Exploring the Long Straddle in Options Trading
Maximizing Profit in Uncertainty
All Simulations are accessible in Thales Options Strategy Simulator (OSS).
Markets are full of uncertainties, and even the most experienced traders face situations where they expect a price change but aren’t sure in which direction. Whether it's due to an upcoming event or just market sentiment, predicting direction can sometimes feel impossible. Long Straddle can work well in such a situation.
The Long Straddle gives traders the opportunity to profit from significant price movements in either direction. Moreover, when implied volatility is low, it can be a perfect time to deploy this strategy if you expect volatility to rise.
While we’ll use Bitcoin in this example, the principles we discuss apply to any underlying asset in options trading. In this blog, we’ll explore how to set up and analyze a Long Straddle, focusing on two key conditions: when you expect large price swings and when implied volatility is low but poised to increase.
The setup of Long Straddle?
The setup involves buying both a call option and a put option at the same strike price (usually current price of the stock) and same expiration date. The goal is to benefit from a large price move, whether it’s an increase or a decrease.

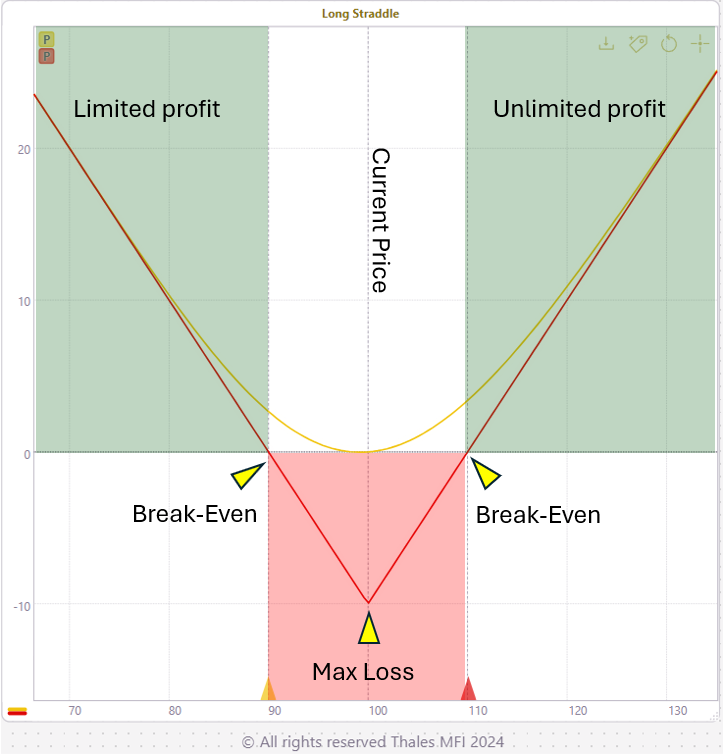
In the graph above, you can see how the Long Straddle’s P&L curve is structured. The potential for profit expands as the price of the underlying moves away from the strike price, either upward or downward. If the price remains near the strike, the loss is capped—limited to the total premium paid for the options.
While this strategy sounds promising, it’s not without its limitations. If the price doesn’t move enough, you risk losing the entire premium. The key is to correctly anticipate that a significant move is coming—just not necessarily in which direction.

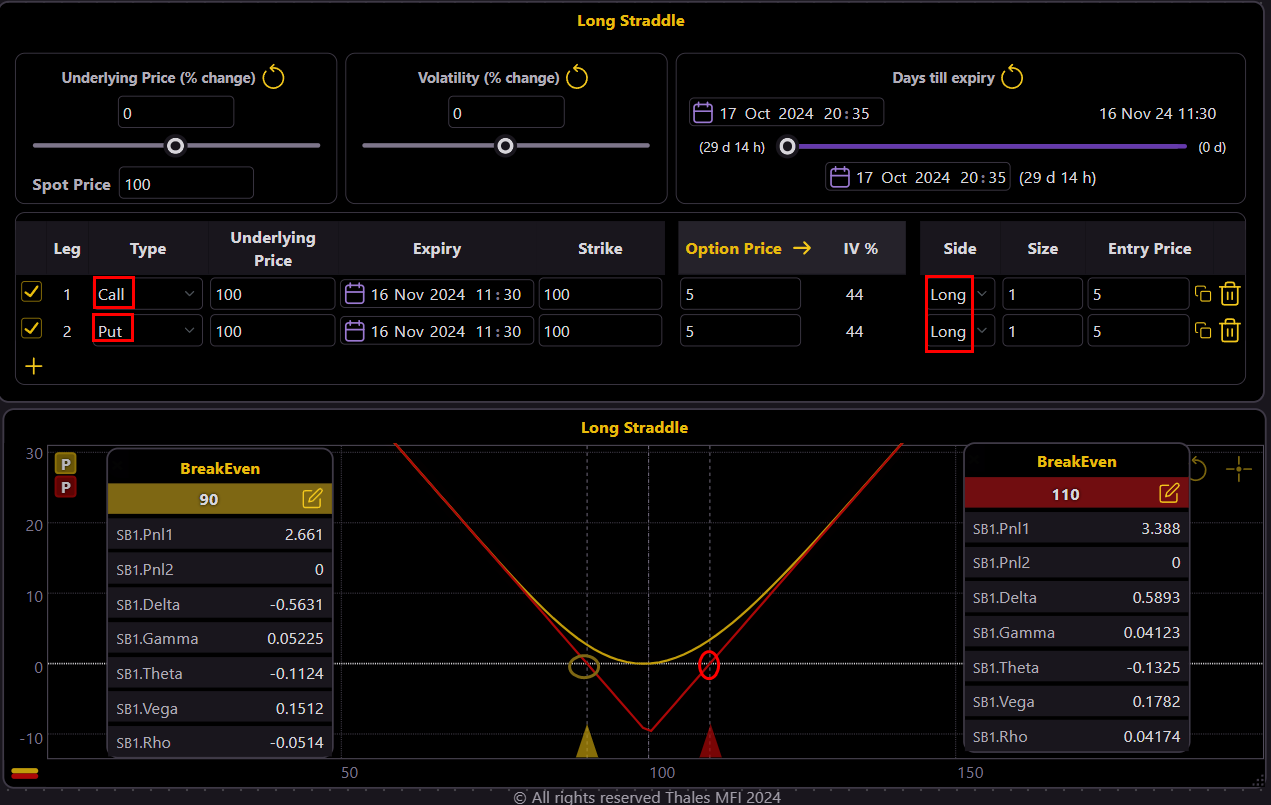
In the image above, we’ve set up a Long Straddle with a call and put at the same strike price. The break-even points, where the strategy starts to turn a profit, are also highlighted. These points indicate the level to which the price of the underlying asset must move for the strategy to become profitable.
While the Strategy Builder tool helps visualize outcomes, the success of this trade still depends heavily on the trader’s judgment about future volatility and price movements. Remember, the power of the Long Straddle lies in its ability to capitalize on a large price swing in either direction.
Choosing Expiration Dates with Precision
Selecting the correct expiration date is crucial to the success of a Long Straddle. Often, traders will look for upcoming events that could cause volatility, such as earnings announcements, economic reports, or political events. For example, the U.S. Presidential Election, scheduled for November 5th, is an event likely to create uncertainty and potential price swings.
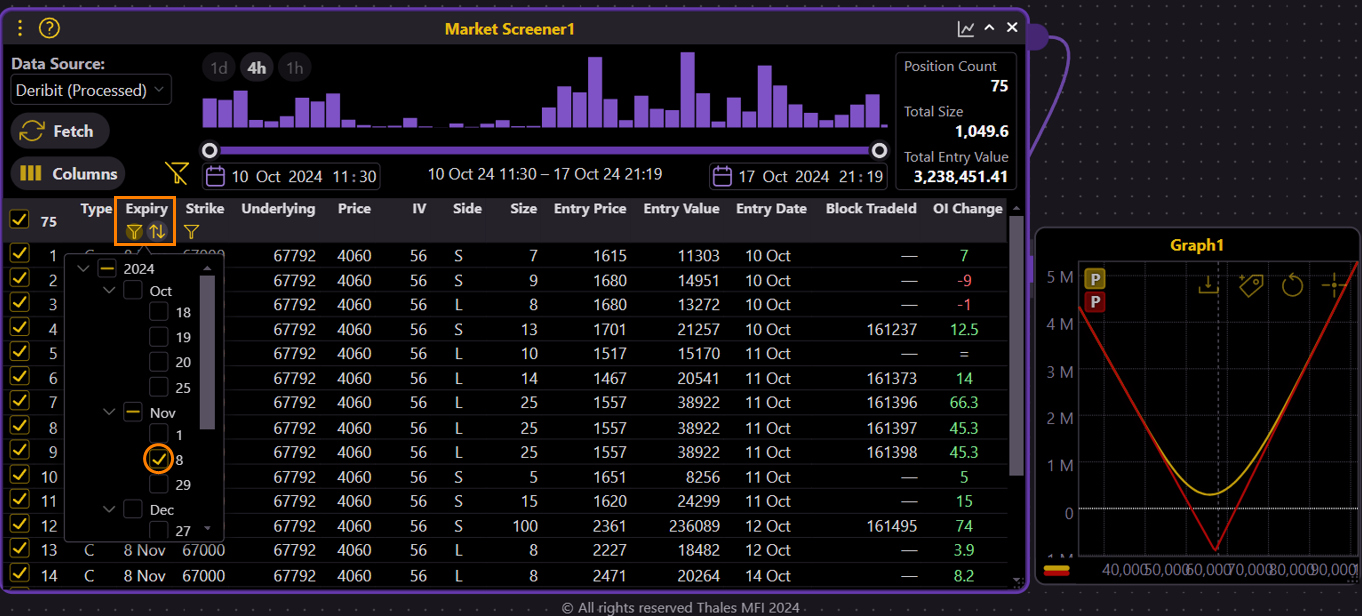
Using the Market Screener in OSS, you can analyze historical volatility and choose the optimal expiry date to capitalize on these events.

We have selected an expiration date around the time of the U.S. election. The Market Screener helps filter options based on expiry and strike price, giving us the ability to make informed decisions based on expected market conditions.
Breaking Down the Individual Legs of a Long Straddle
While the Long Straddle strategy involves two options contract, it’s helpful to break down each leg individually. The call option profits when the price of the underlying asset rises, while the put option profits when the price falls. Together, these options create a hedge, where one leg always benefits from a price movement, regardless of the direction.

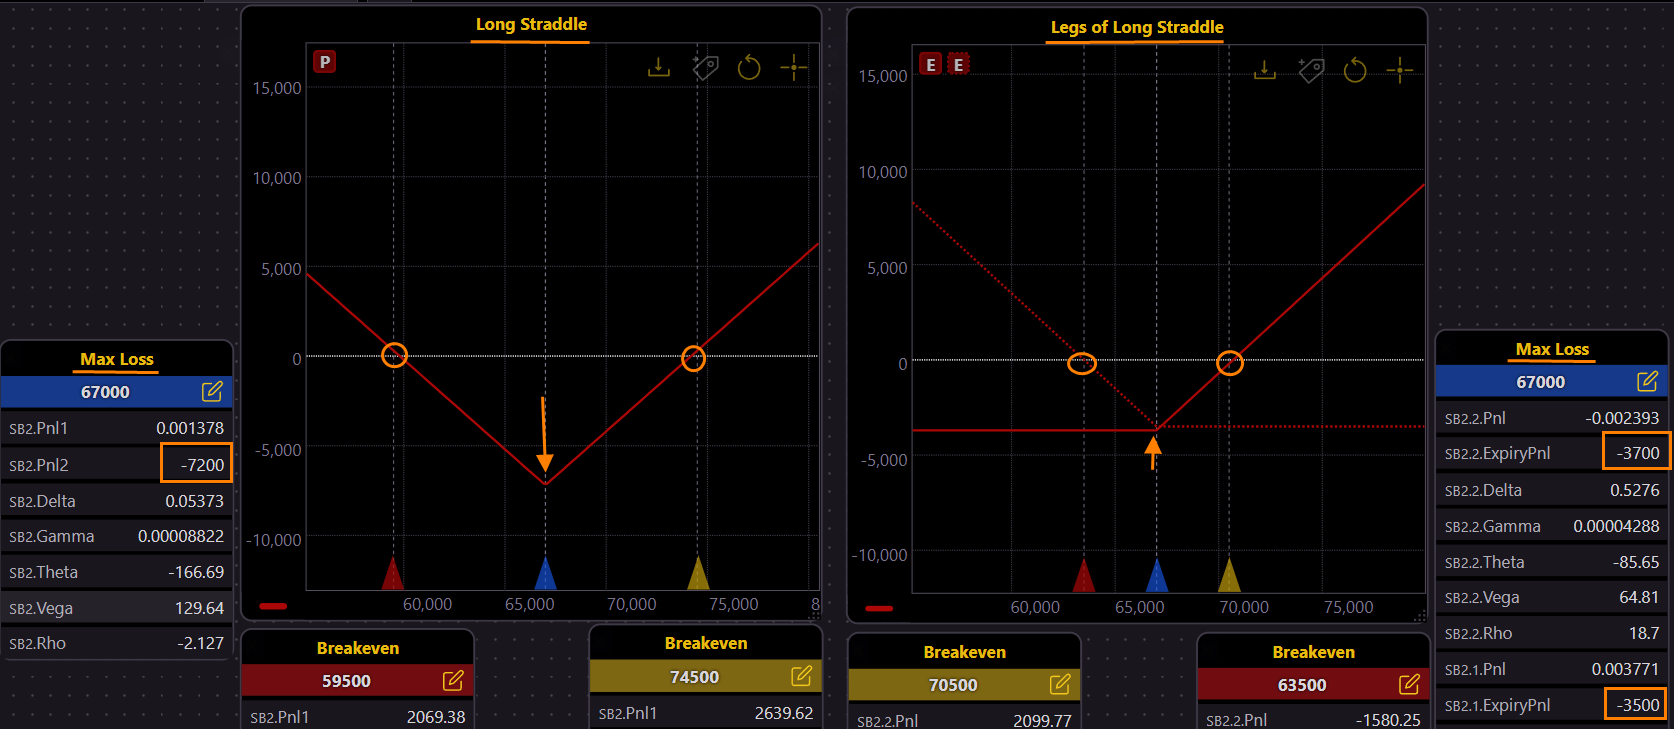
In the graph above, we can see the separate P&L profiles of the call and put options. The key feature of the Long Straddle is that it combines these two positions into one cohesive strategy. Let’s break this down further:
Break-Even Points:
With a single call or single put option, the break-even is typically just above or below the strike price, depending on whether you're long the call or the put. For example, if you bought a call at a strike price of $70,000, the break-even point would be the strike price plus the premium paid.
In a Long Straddle, there are two break-even points, not one: one above the strike price and one below. This is because the combined premiums of the call and put need to be covered. In our example, with Bitcoin at $70,000, the break-even points might be $68,000 and $72,000, depending on the premiums paid for each option.
By looking at the graph, you’ll notice that these break-even points are further apart compared to a single option. The combined premium cost means that the underlying asset needs to move more significantly in either direction before the strategy turns a profit. This is one reason why traders use Long Straddles when they expect large price swings.
Maximum Loss:
With a single option, whether it’s a call or put, the maximum loss is limited to the premium paid for that one contract.
In a Long Straddle, the maximum loss occurs if the price of the underlying asset remains exactly at the strike price at expiration. Neither the call nor the put would have any intrinsic value at this point, meaning the trader loses the entire combined premium of both options.
As shown in the graph, this maximum loss is highlighted when the price stays near the strike at expiration. The two options’ losses combine, meaning you lose both premiums.
However, the benefit of the Long Straddle is that the profit potential is unlimited in either direction. If the price moves far enough from the strike—whether up or down—the position becomes profitable, unlike a single option where profit potential is typically limited to the side of the movement (either up for calls or down for puts).
This is what makes the Long Straddle a popular strategy during periods of anticipated volatility: the potential for gains from both directions outweighs the risk of losing the premiums if the price remains stagnant.
Implied Volatility and Timing
One of the most important aspects of the Long Straddle is the role of implied volatility (IV). When implied volatility is low, option premiums tend to be cheaper, making it an attractive moment to enter the trade. However, the real power of this strategy lies in a future rise in volatility. As implied volatility increases, the value of both the call and the put will rise, regardless of whether the price moves dramatically.

Take a look at the graph above, where we’ve increased implied volatility by 20%. Notice how the profit potential expands. The yellow curve represents the P&L before expiry, indicating what happens if you choose to close the position before the options expire. This flexibility allows traders to take profits early, depending on market conditions.
It’s crucial to enter the strategy when implied volatility is low and likely to rise, which requires a sharp eye on market conditions.
In cases where the price begins to move in a specific direction, traders can also modify the position. For instance, they could close one leg (either the call or the put) or roll the remaining position to a new strike price to manage the trade. However, we won’t go into these adjustment strategies in detail here, as they deserve a dedicated discussion in future blogs.
Of course, nothing is guaranteed. Predicting a volatility spike is often the hardest part of this strategy. But if you can time it well, the Long Straddle can offer significant profit potential.
Bottom Line
The Long Straddle is a strategy suitable for moments of market uncertainty, providing profit potential from large price swings in either direction. When implied volatility is low but expected to rise, this strategy can become even more powerful, allowing traders to profit from the increase in volatility as well as the movement of the underlying price.
While Bitcoin was used in our example, the Long Straddle applies to any market where options are traded. Tools like OSS can help visualize the potential outcomes, but ultimately, the decision to use this strategy rests with the trader’s market outlook and risk tolerance.
All Simulations are accessible in Thales Options Strategy Simulator (OSS).
Disclaimer
This blog is for educational purposes only and does not constitute financial advice. Options trading carries risk, and traders should conduct their own research before making any financial decisions.