Introduction
Options trading is a game of probabilities, opportunities, and, sometimes, illusions. Among the most deceptive phenomena is the volatility smirk—a subtle but powerful feature of implied volatility curves. While a smirk might appear harmless, it can silently erode profits even when the price moves in your favor. In this blog, we’ll unpack the volatility smirk, analyze its impact using detailed simulations, and show why understanding it is critical for crafting successful options strategies.
What Is the Volatility Smirk?
The volatility smirk describes the uneven curve of implied volatility (IV) across strike prices for the same expiration date. Unlike the symmetrical volatility "smile," the smirk is often skewed, reflecting market demand for downside protection (puts) or speculative upside moves (calls).
Why does this matter?
Elevated IV reflects that options are relatively expensive, even if their absolute price appears low. The volatility smirk highlights this phenomenon: traders might overlook the fact that they are paying a premium relative to the option’s payoff potential. Understanding and accounting for this relationship is critical when designing strategies, as we’ll demonstrate through simulations.

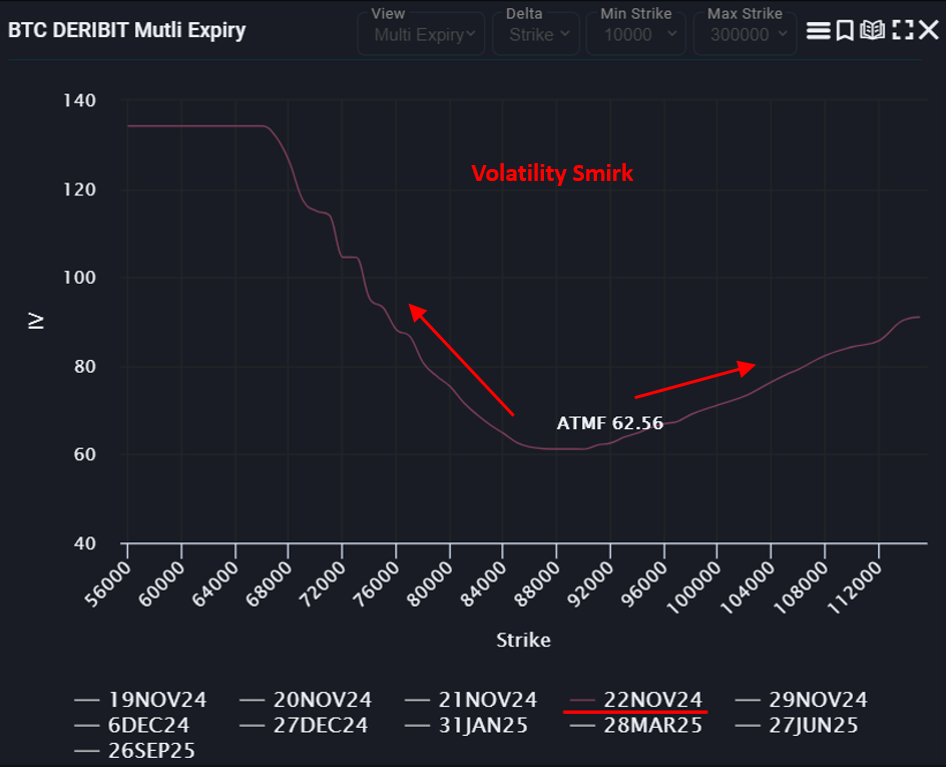
In the chart above, we observe a volatility smirk for Bitcoin options expiring on 22 November 2024. The IV for OTM puts (and ITM calls) is higher than for OTM calls (and ITM puts). However, it’s important to note that this IV pattern is not universal.
The shape of the volatility smirk (or smile) depends on the specific expiry and reflects the current market sentiment for that expiration. Different expiries or shifts in market conditions can create vastly different patterns.
Bridging the Theory to Practice
Now that we’ve explored the concept of the volatility smirk and its implications, let’s take a closer look at how this phenomenon plays out in the real-world Bitcoin options market. Using the OSS simulator, we’ll analyze actual Bitcoin options to understand how implied volatility impacts option pricing and strategy profitability. Through these simulations, we’ll see how the smirk shapes outcomes and what traders need to consider when building strategies. Let’s dive in.
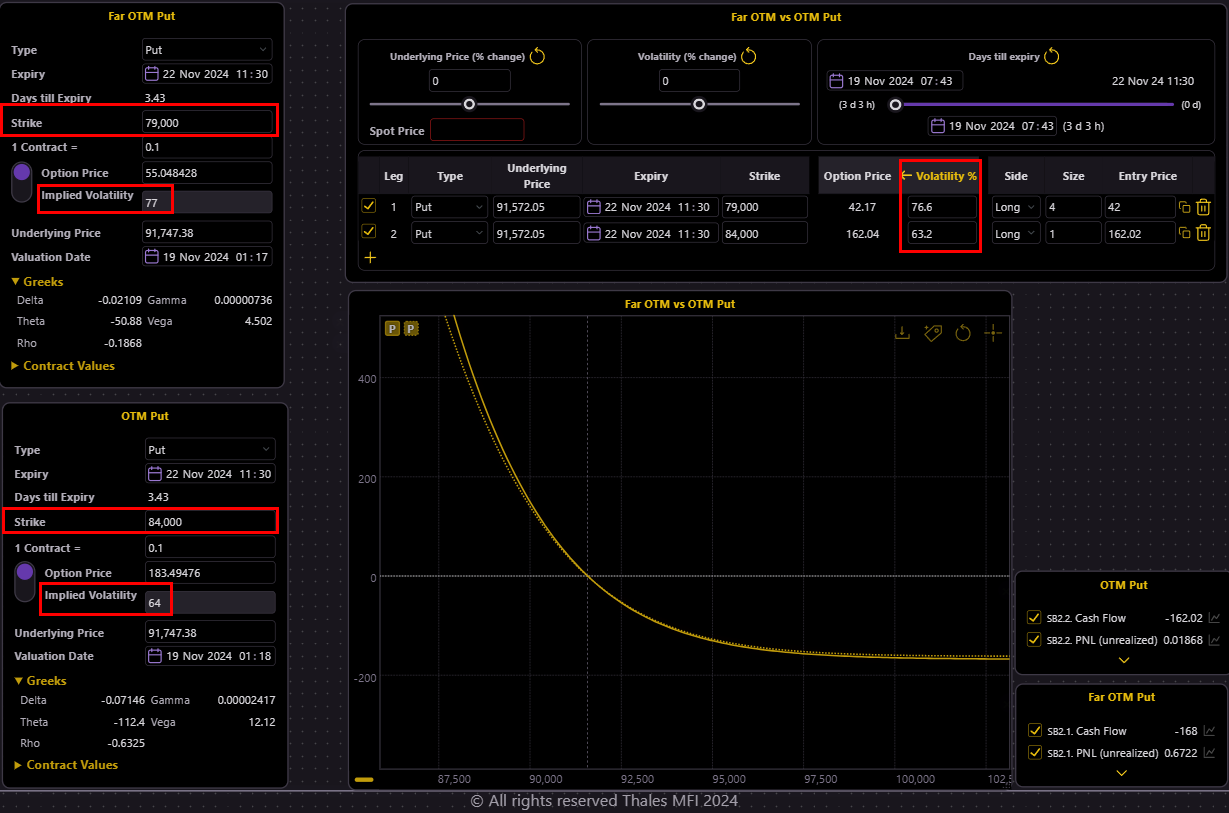
Let us select two OTM put options for the 22 November 2024 expiry—the same expiry where we observed the volatility smirk in the earlier chart.

As shown in the Black-Scholes widgets (widgets in the right), and with the index price of the underlying (Bitcoin) around $90,000:
The far OTM put (strike $79,000) has an IV of 76.6%, reflecting the elevated IV observed in the smirk.
The OTM put (strike $84,000) has a lower IV of 63.2%, yet still higher compared to at-the-money (ATM) options.
To keep the investment amount consistent, we bought 4 contracts of the far OTM put (which is approximately one-fourth the price) and 1 contract of the OTM put. This ensures that the results are comparable while accounting for the effect of higher IV on relative pricing.
Please note that the graph is showing the current PnL of the options rather than the PnL at expiry. This choice allows us to observe the real-time effects of IV and price changes on the options' value, highlighting how the smirk shapes profitability before expiration.
The Price Moves in Our Favor

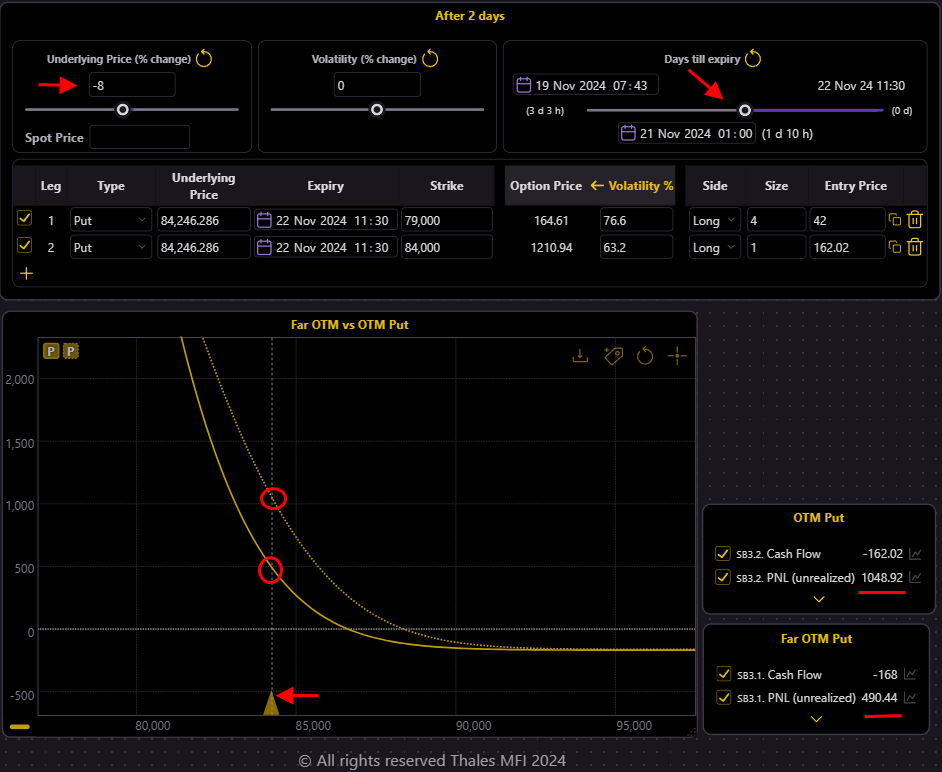
In this scenario, we explore the impact of an 8% drop in Bitcoin’s price (from $91,747 to $84,246) while keeping the IV constant. The results:
- The $84,000 strike (OTM Put) shows a PnL of $1,048, as the option is now closer to being at-the-money.
- The $79,000 strike (Far OTM Put) shows a PnL of $490, as the price moves closer to its strike.
At first glance, the strategy seems to work well—both options are profitable as the price moves in favor of the puts. However, this doesn’t account for a critical real-world adjustment: IV compression.
In reality
In real markets, as an option’s strike price approaches the spot market price, its implied volatility decreases.This happens because options closer to the underlying price lose their speculative value and begin behaving more like the underlying asset. Let's adjust our simulation.

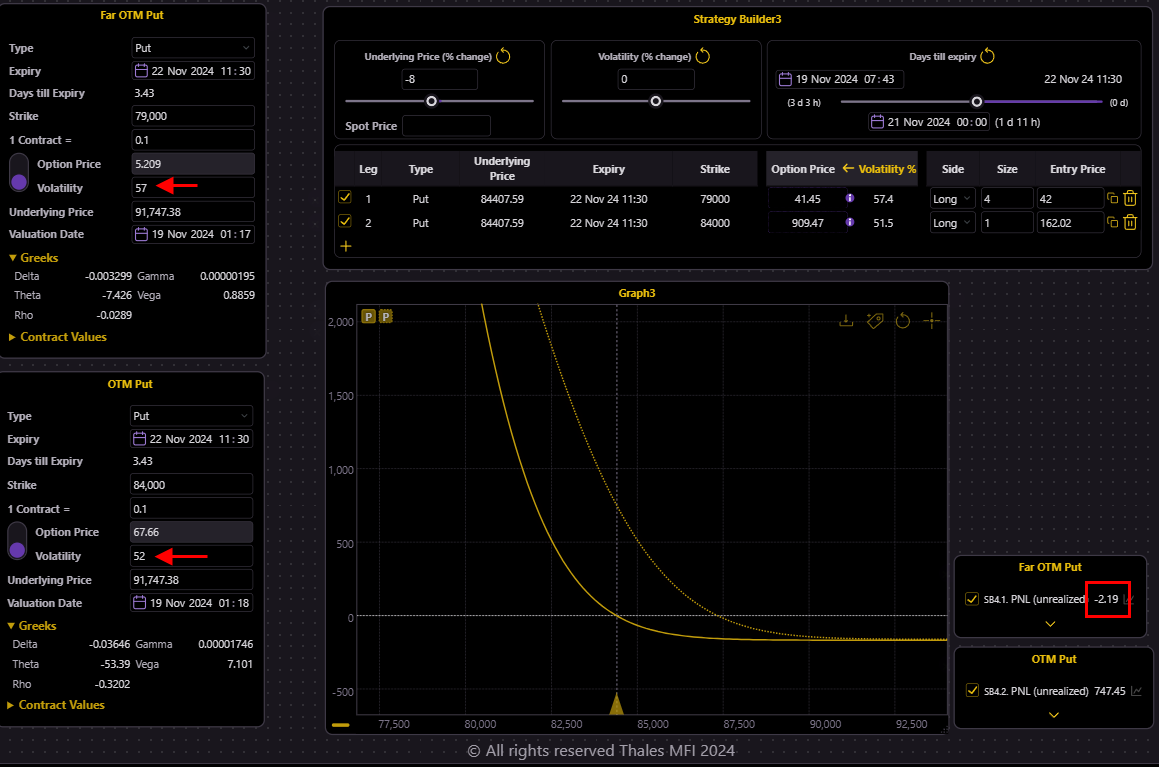
After tuning the inputs, our simulations better reflect the reality.
- $84,000 Strike (OTM Put): IV decreases from 63.2% to 52%, reducing the PnL to $747.
- $79,000 Strike (Far OTM Put): IV decreases from 76.6% to 51%, resulting in a slight loss for the position.
Even though the price drop moved the strategy closer to profitability, as we see, the IV significantly reduced the profits, demonstrating the importance of factoring in IV adjustments.
Bottom Line: Don’t Let the Smirk Fool You
The volatility smirk is more than a quirk of the options market—it’s a reflection of market sentiment that carries significant implications for your trades. As we’ve seen, the smirk can inflate premiums (relatively) and reduce profits, even when the price moves in your favor. By understanding this phenomenon and simulating its effects, you can design smarter strategies that account for real-world conditions.
Next time you see a volatility smirk, remember: what seems like a small tilt on a chart can have a big impact on your bottom line. Use the OSS simulator to decode the smirk and stay ahead of the game.
Disclaimer
This blog is for informational purposes only and not financial advice. Options trading involves significant risk and may not be suitable for all investors. Simulations are hypothetical and for illustrative purposes only. Always do your own research and consult a licensed financial advisor before trading.