Introduction
In our ongoing OUTLOOK series, we have closely followed the Bitcoin options market, monitoring key events and expiries that shape its dynamics. Recently, one of the most significant political events with anticipated financial consequences was President Trump taking office on January 20. His inauguration held particular importance for the crypto world, as Trump’s campaign prominently featured strong support for Bitcoin and cryptocurrencies.
Naturally, the market braced for bullish movements and heightened fluctuations in Bitcoin’s price as the event approached. The Bitcoin options market, known as both a safe haven for hedging against market shocks and a powerful tool for speculating on price actions, reflected these sentiments vividly.
In this blog, we track the ripples of this historic event across the Bitcoin options market—starting with the January 21 expiry that settled today and extending to the upcoming key expiries. Join us as we explore the traders' activities, strategies, and expectations during this pivotal time.
Try Thales OSS for Simulating your own strategies and Market Analysis.
Backwardation
As the inauguration of President Trump on January 20 approached, fluctuations were observed across various financial markets, particularly in high-risk assets like Bitcoin. The prevailing uncertainty and speculative sentiment among traders led to an unusual backwardation in the Bitcoin options market—a phenomenon rarely seen in such markets.
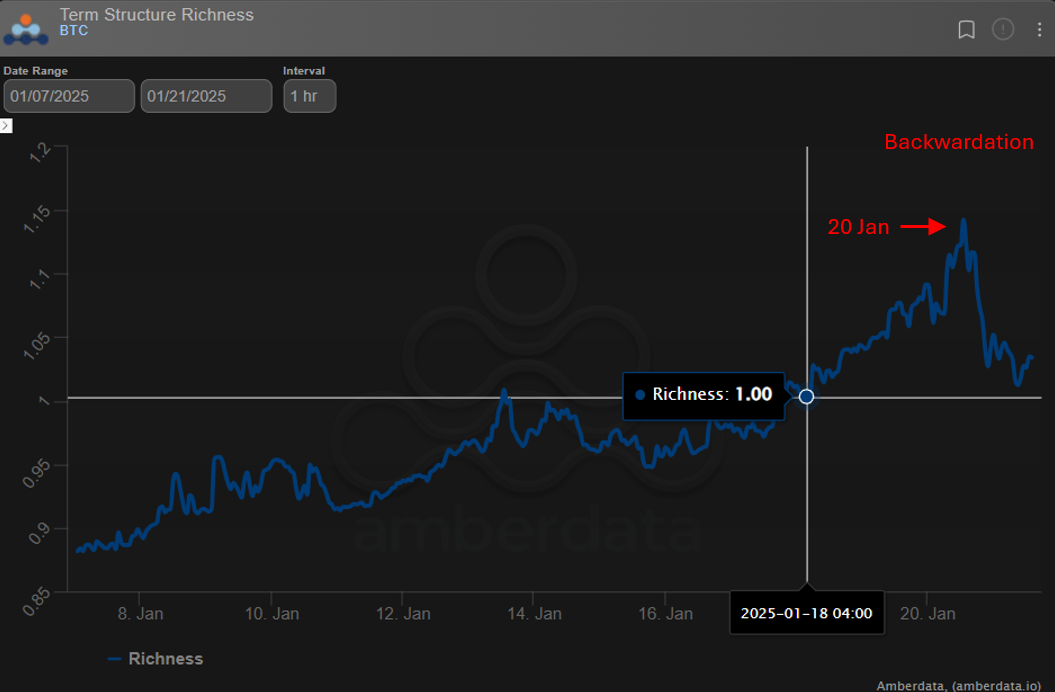
In the context of term structure (see the chart above), a value above 1 signifies backwardation, where shorter-term options are relatively more expensive, or "rich," compared to longer-term contracts. This condition highlights the market's focus on imminent events, as traders anticipate heightened volatility in the short term.
Fishing the Waves
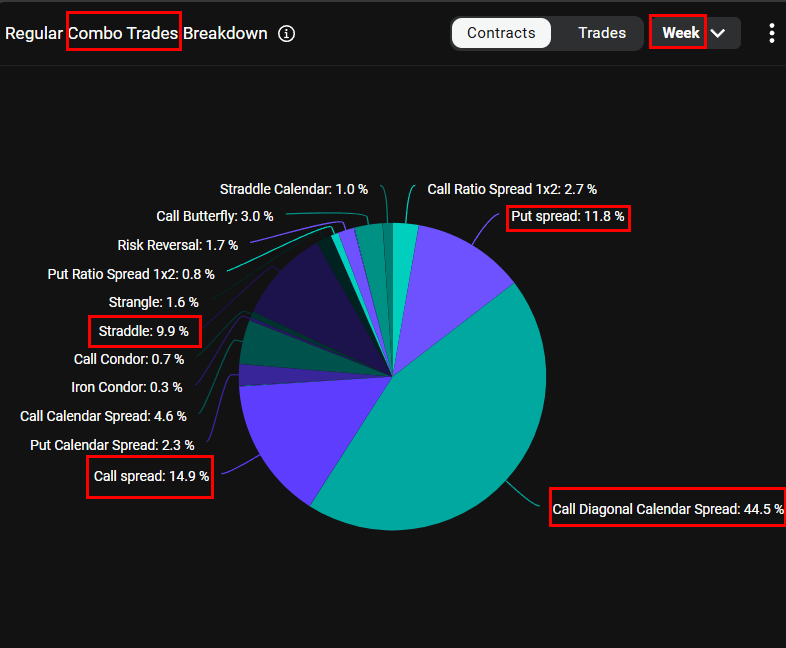
In the context of heightened market activity around the political event, the strategies employed by combo traders provide further insights into the market sentiment. The chart above highlights the breakdown of strategies over the past week, with the Call Diagonal Calendar Spread being the most popular, representing 44.5% of the total trades. This strategy aligns well with the backwardation observed in the market, as traders capitalize on the opportunity to sell expensive short-term call options while purchasing longer-dated options at relatively fair prices.
Volatility Peaks
This phenomenon was also evident in the implied volatility (IV) of Bitcoin options, as reflected in the Deribit DVOL Index.
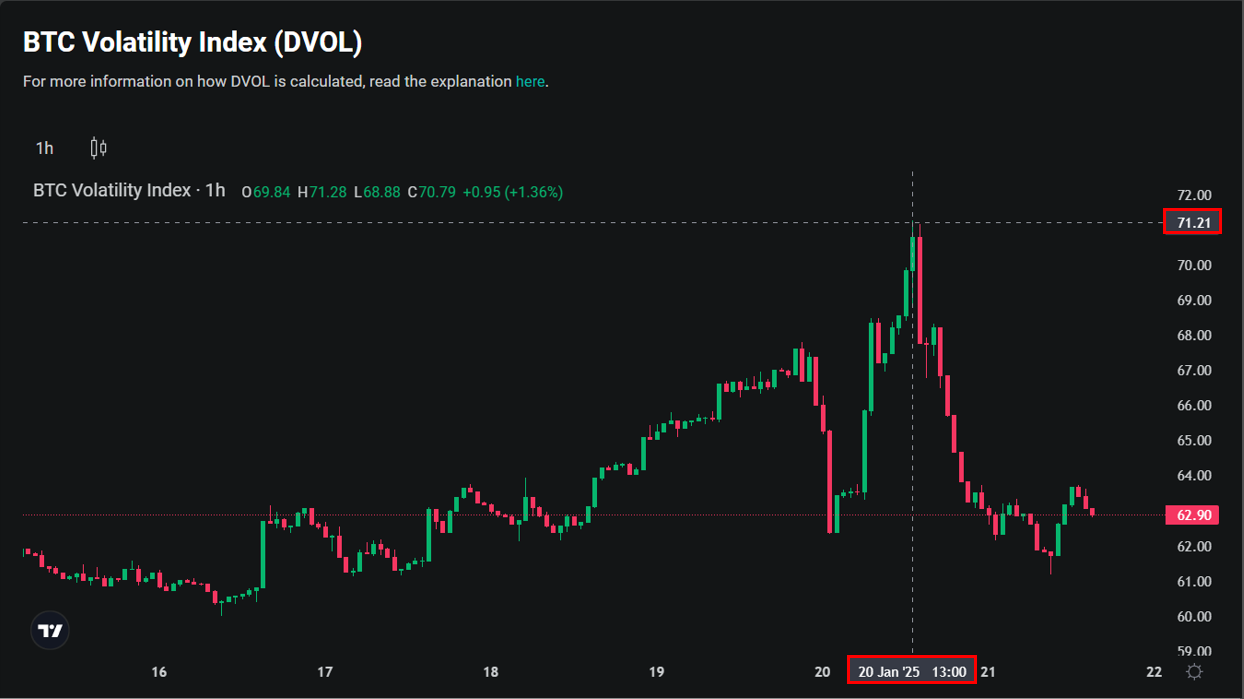
The chart shows a significant spike in IV on January 20th, coinciding with President Trump’s inauguration day.
21 Jan Options Expire Close to Max Pain Level
The open interest (OI) data for this specific expiry highlights a strikingly high concentration of call options at the $112,000 strike price.
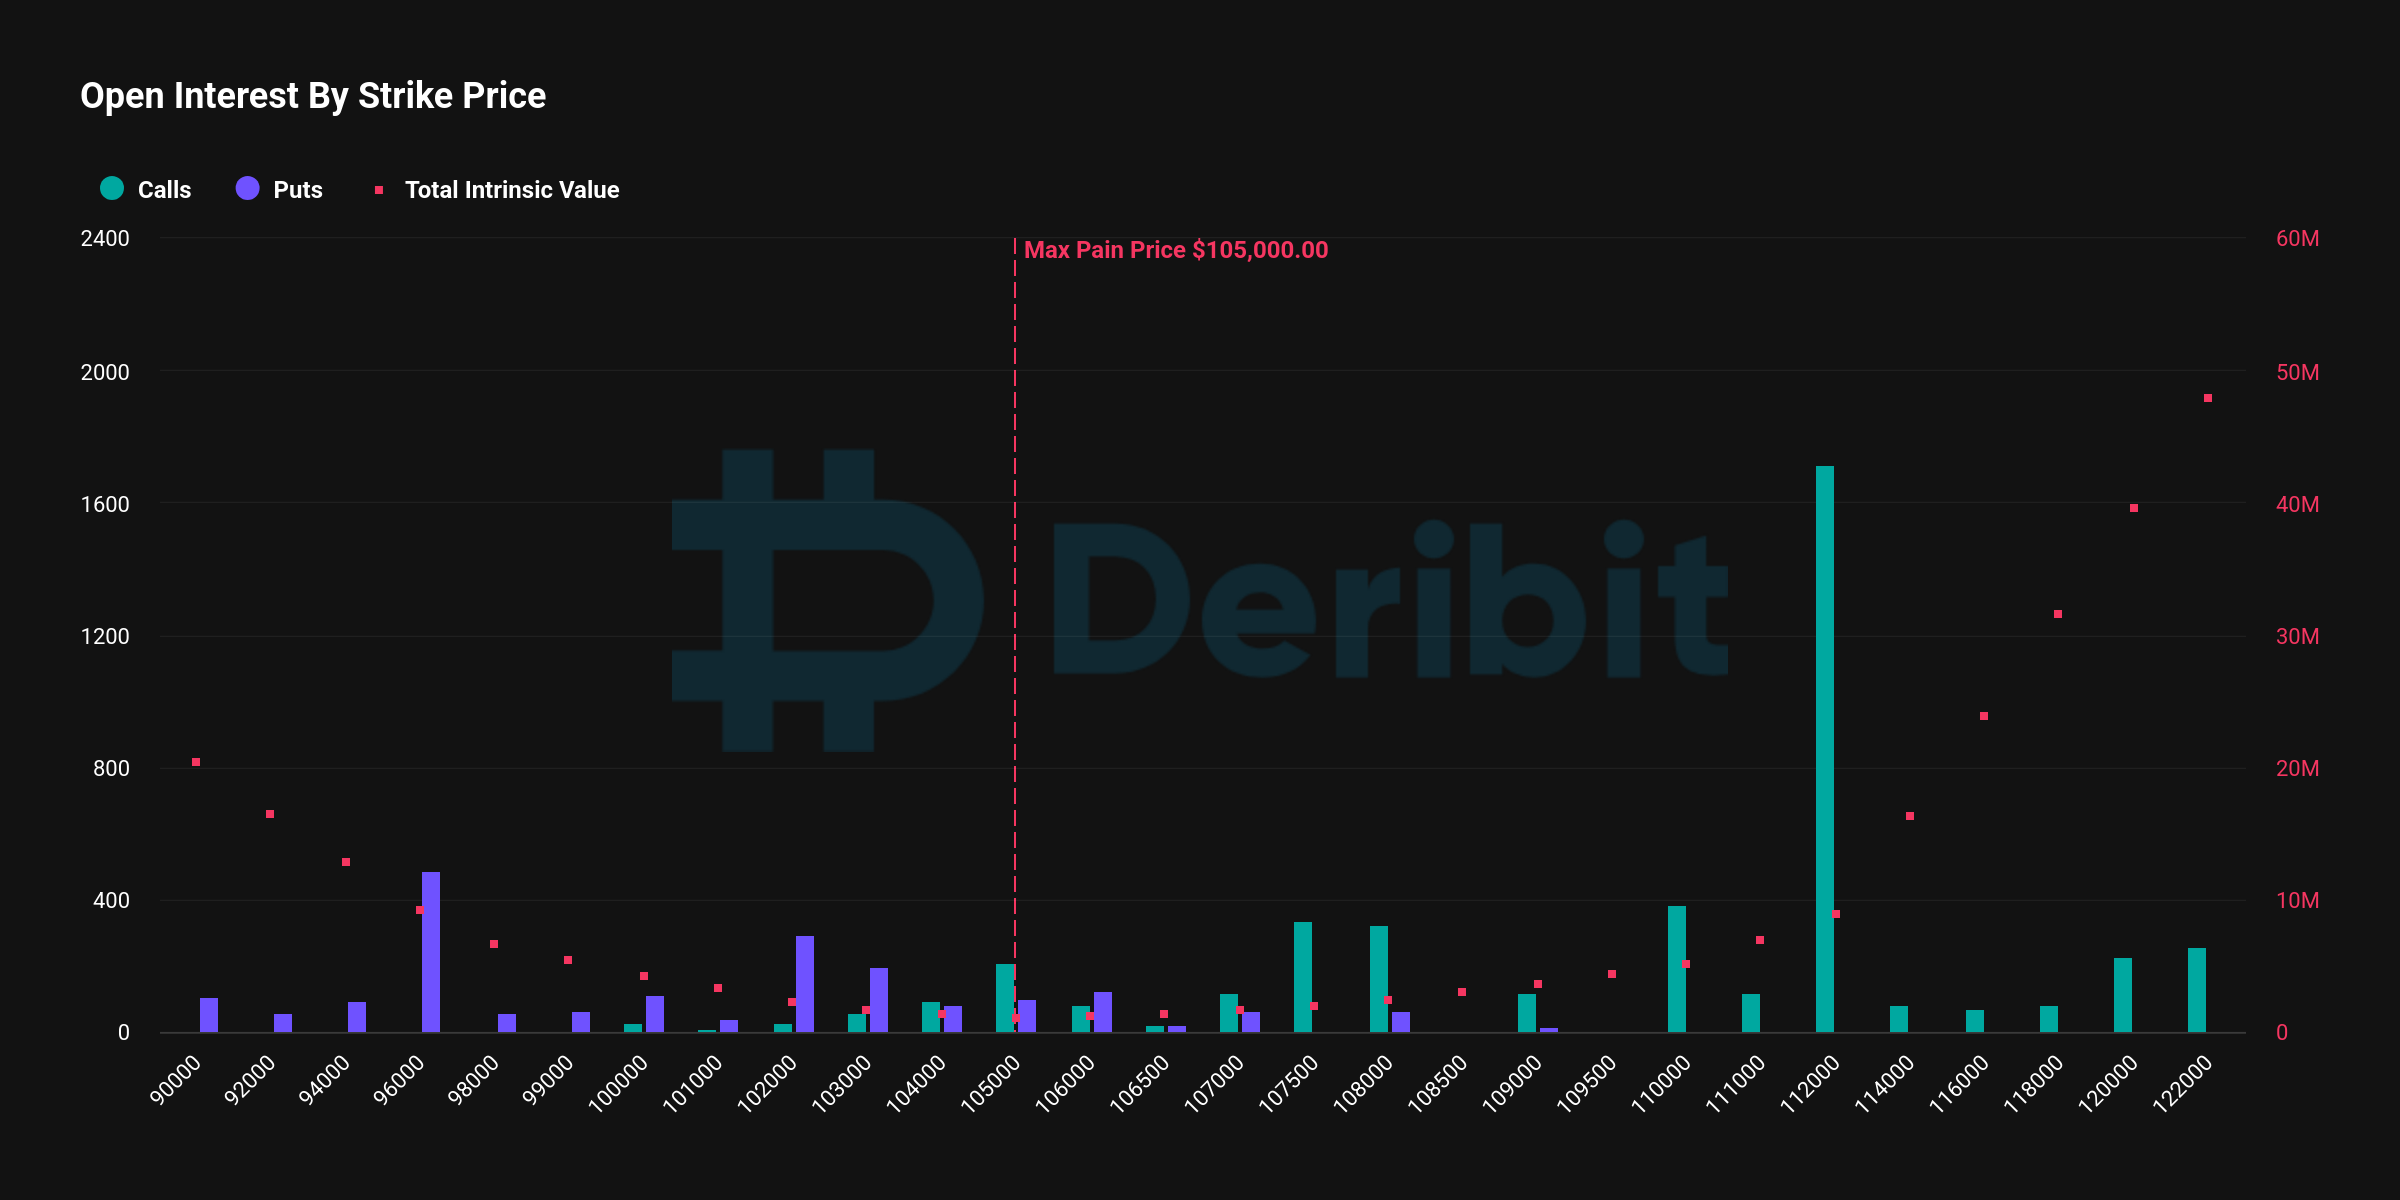
This notable interest suggests a bullish sentiment among traders, possibly driven by the anticipation that Bitcoin’s price could surge with President Trump, perceived as pro-crypto, taking office. Many traders appeared to speculate on a significant price rally, opting for these far out-of-the-money (OTM) call options. This wave of optimism has influenced the Max Pain price—a level where most options for the expiry would expire worthless—pulling it toward $105,000.
As the event approached, intense price fluctuations swept through the Bitcoin market, driven by speculative and short-term trading activity. This turbulent period forced many scalpers and short-term traders in the perpetual market to liquidate their positions due to stop-loss triggers on both ends of the spectrum. However, as is often the case, the market gradually gravitated toward the Max Pain price by the time of settlement.
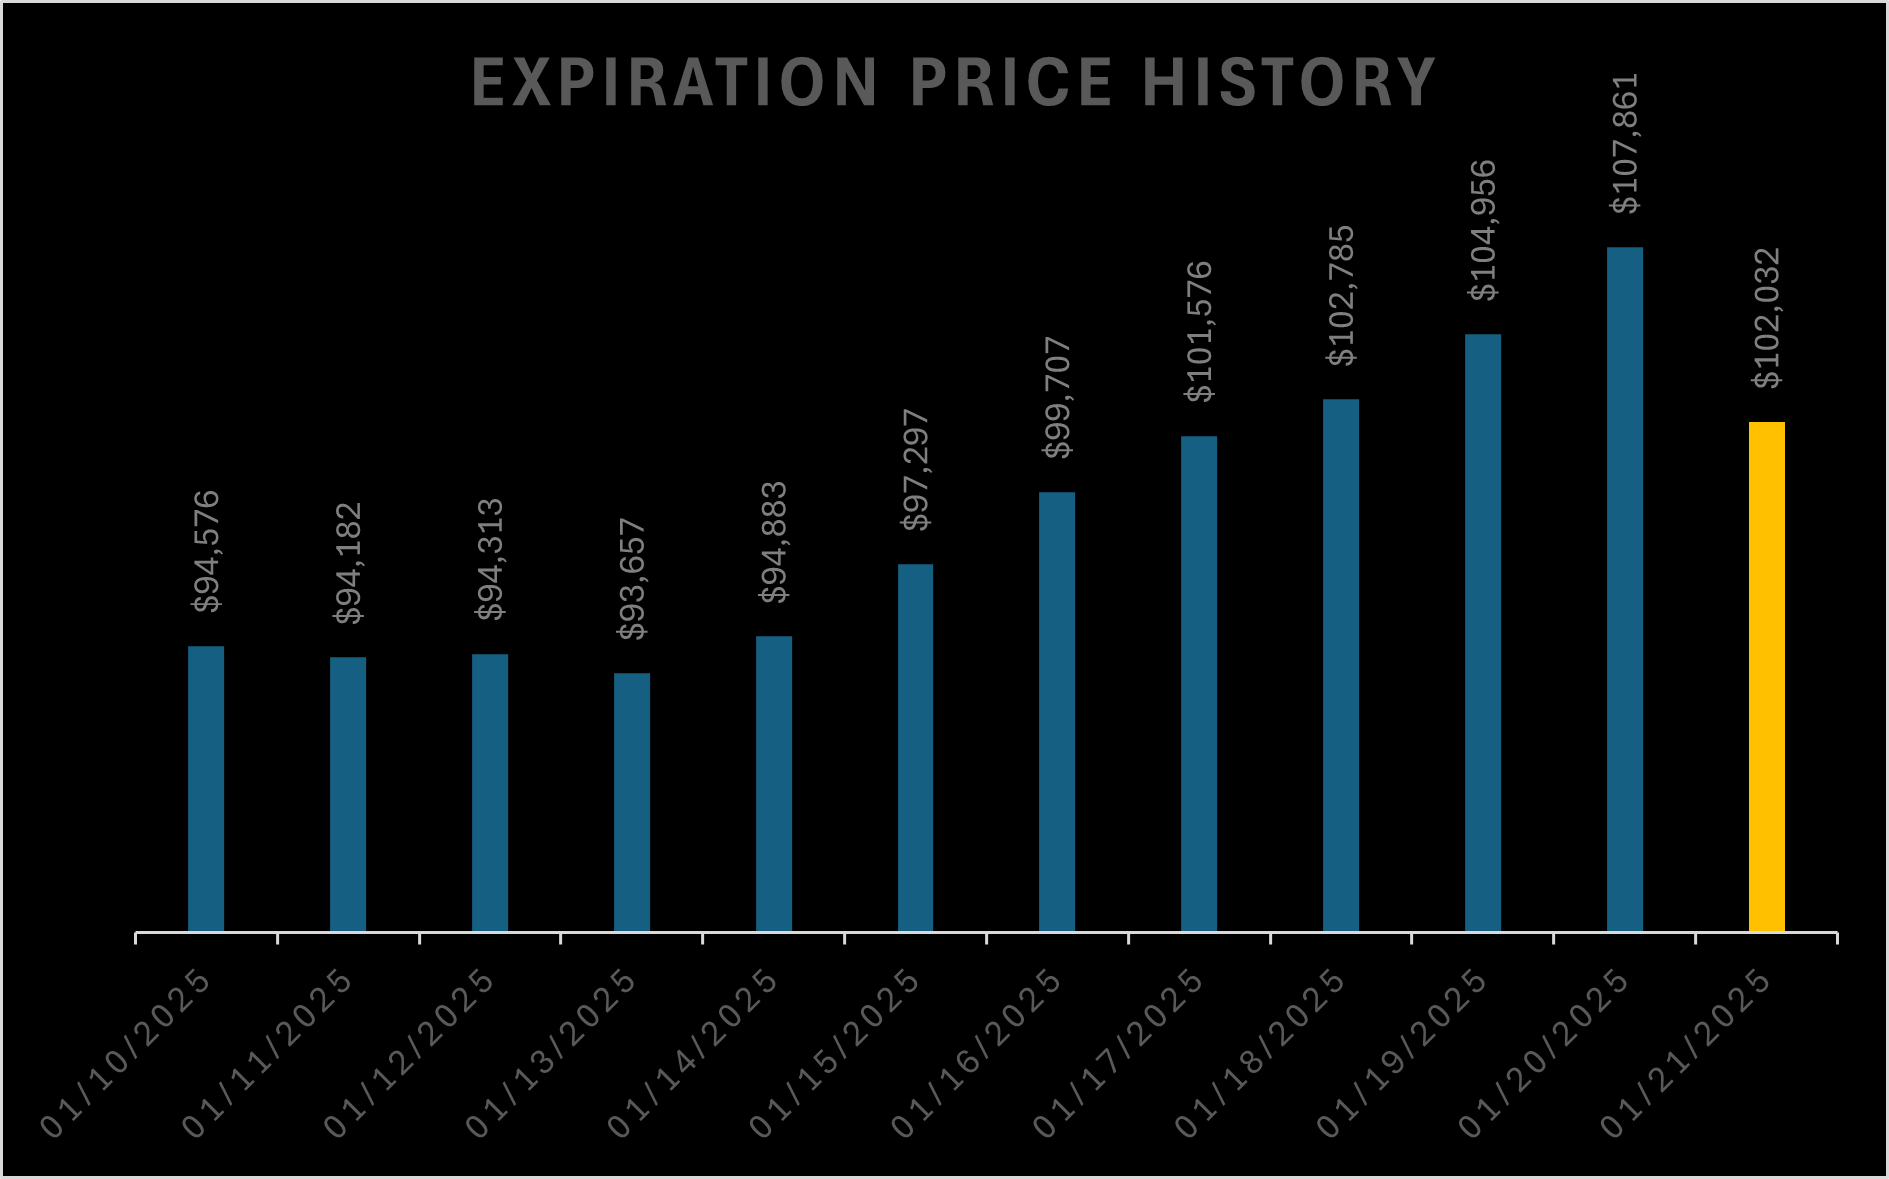
The graph illustrates the final settlement price of $102,000 for the expiry which aligned closely with the Max Pain level. This outcome particularly disappointed call option holders who had held onto their contracts until expiry, hoping for a higher price.
Upcoming Expiries
As the Bitcoin options market shifts focus to the upcoming expiries, traders are already preparing for their next moves. The chart below highlights significant activity around the 24th and 31st of January expiries, with the latter standing out as a key expiration date. However, an interesting distinction emerges when comparing the two.
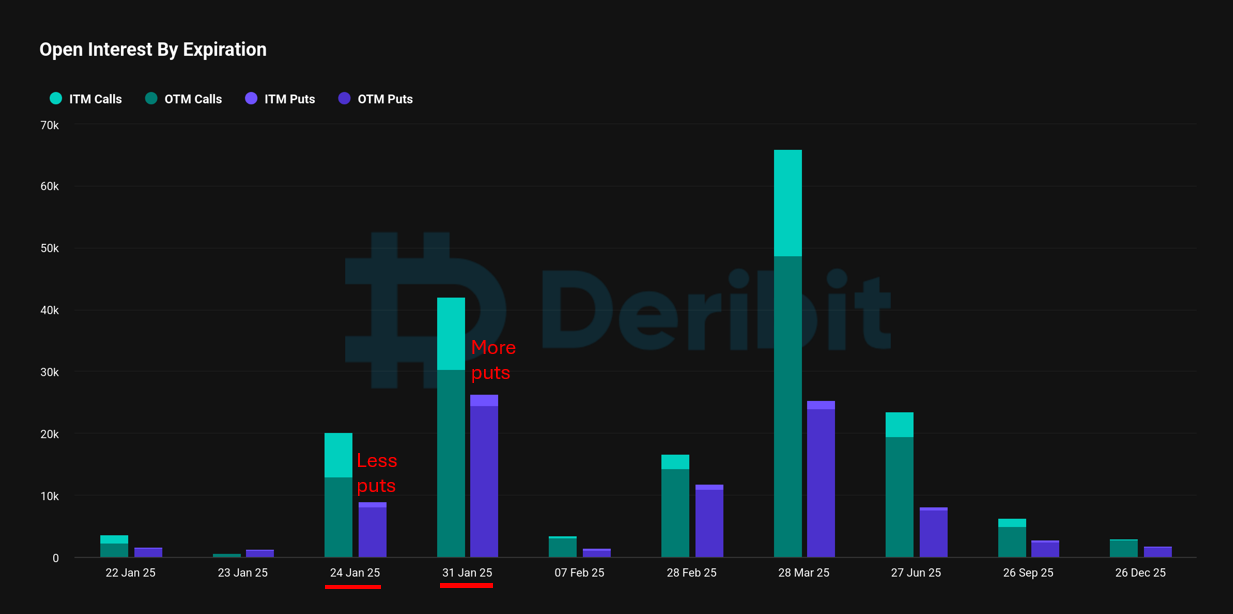
For the 24th January expiry, the dominance of call options reflects a more bullish sentiment among traders, possibly driven by lingering optimism. In contrast, the 31st January expiry sees a relatively heavier emphasis on put options, suggesting a more cautious and conservative outlook. This disparity may indicate that while some traders still hope to ride the wave of excitement, others are hedging their bets, recognizing the protective value of put options during turbulent times. As seasoned traders know, in uncertain markets, put options often act as a reliable safety net.
Heatmap
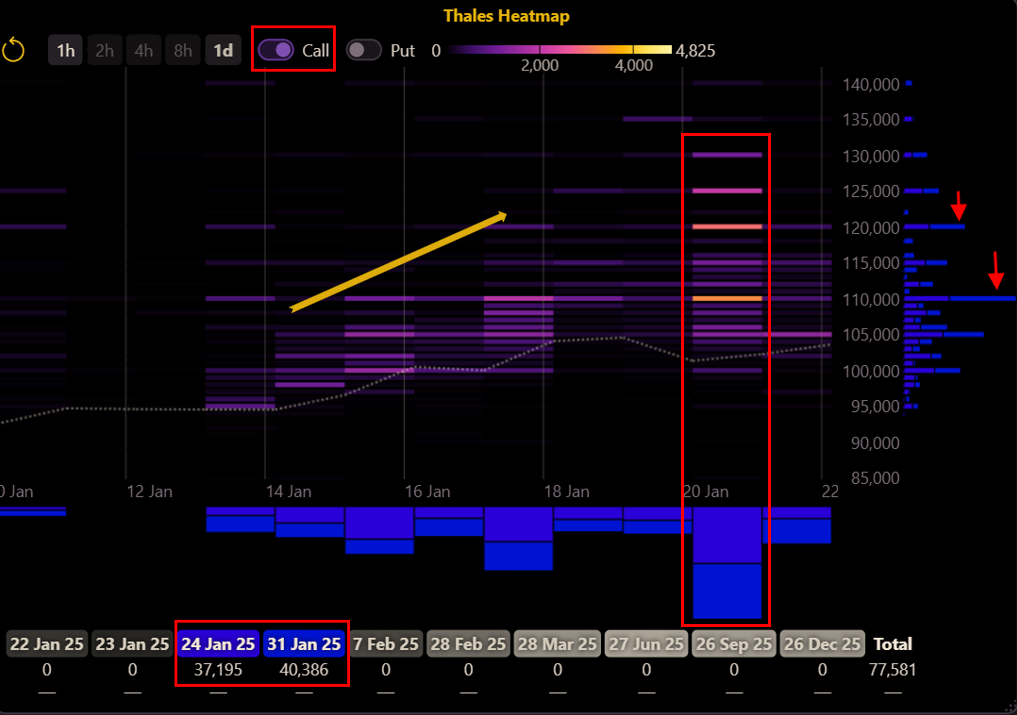
The Thales Heatmap offers a comprehensive view of options traders' activity, providing a vivid representation of trading volumes across strikes, expiries, and timeframes.
Calls
(OSS)
The heatmap shown here focuses on the last 7 days of activity, filtered specifically for call options expiring on January 24 and January 31.
As illustrated, call strikes have shifted upward, closely tracking Bitcoin's price movements, reflecting how traders adapt to market trends. Notably, January 20 stands out as a particularly active day, with a significant spike in trading volume for both expiries. The intense activity is especially visible at the 110,000 and 120,000 strike levels.
Puts
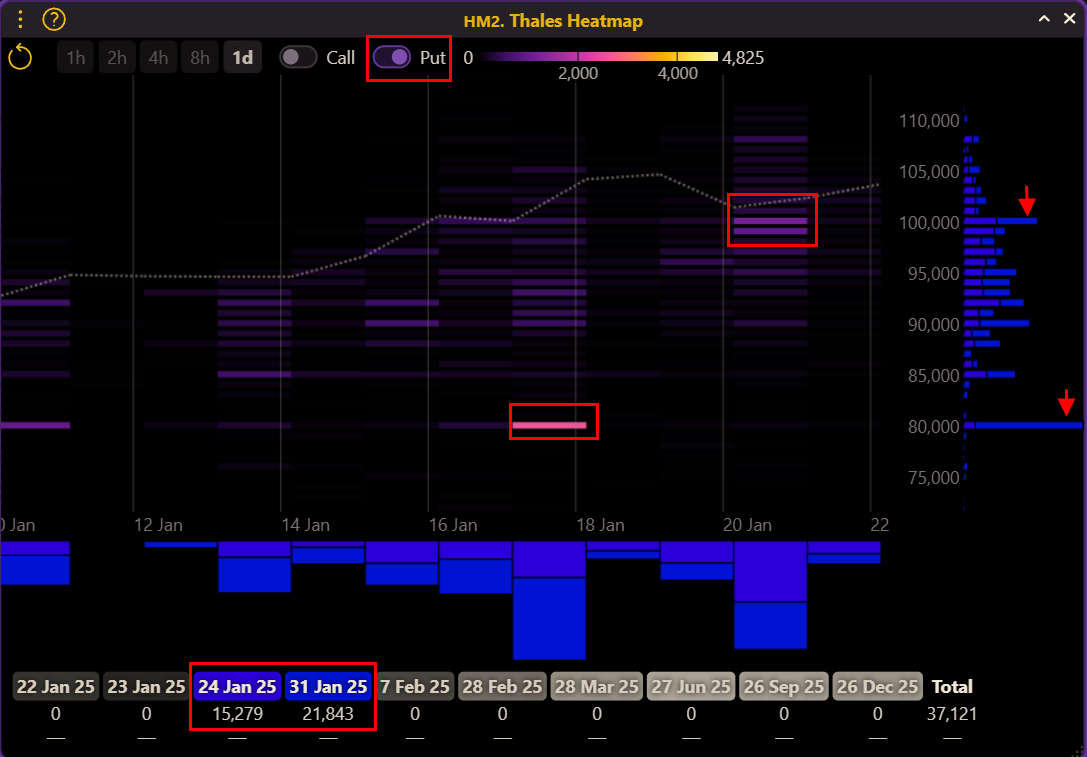
Switching the focus to put options, the Thales Heatmap filtered for the same time frame and expiries—January 24 and January 31—reveals a contrasting picture.
(OSS)
The cooler tones on the heatmap indicate significantly lower trading volumes for put options, particularly for the nearer expiry.
While some activity can be observed around key strikes like $80,000 and $100,000, it is evident that puts have garnered far less attention compared to calls during this period.
Market Screener
The market outlook gains depth when analyzed per expiry using the Thales Market Screener.
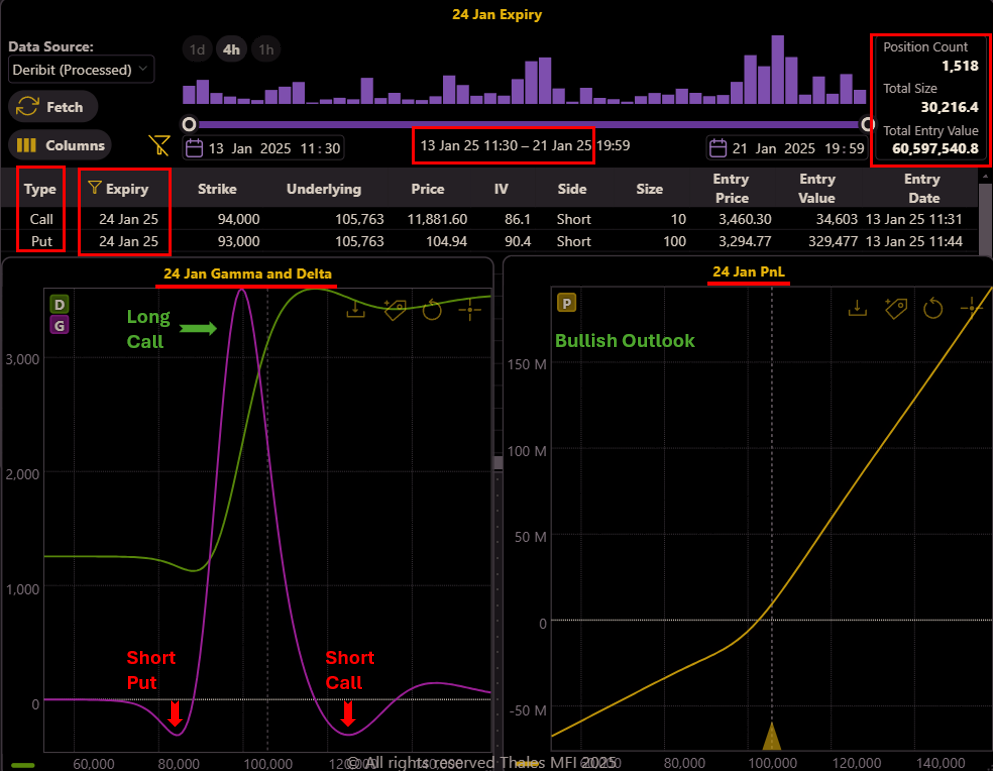
24 Jan
(OSS)
Here, the widget is filtered for the January 24 expiry and captures data from the past seven days. Without further filters, the insights are clear and revealing.
The PnL graph on the right, representing the overall positions for this expiry, strongly indicates a bullish stance. This is evident from the resemblance to a long position, characterized by predominantly long call options and a smaller proportion of short put positions.
The Gamma and Delta graph on the left provides a more detailed breakdown. The positive Gamma curve highlights that the market has been predominantly long, with long calls around an average strike of $99,000 contributing significantly to this outlook. Additionally, small short positions for out-of-the-money (OTM) calls and puts are evident, as seen in the minor negative Gamma spikes.
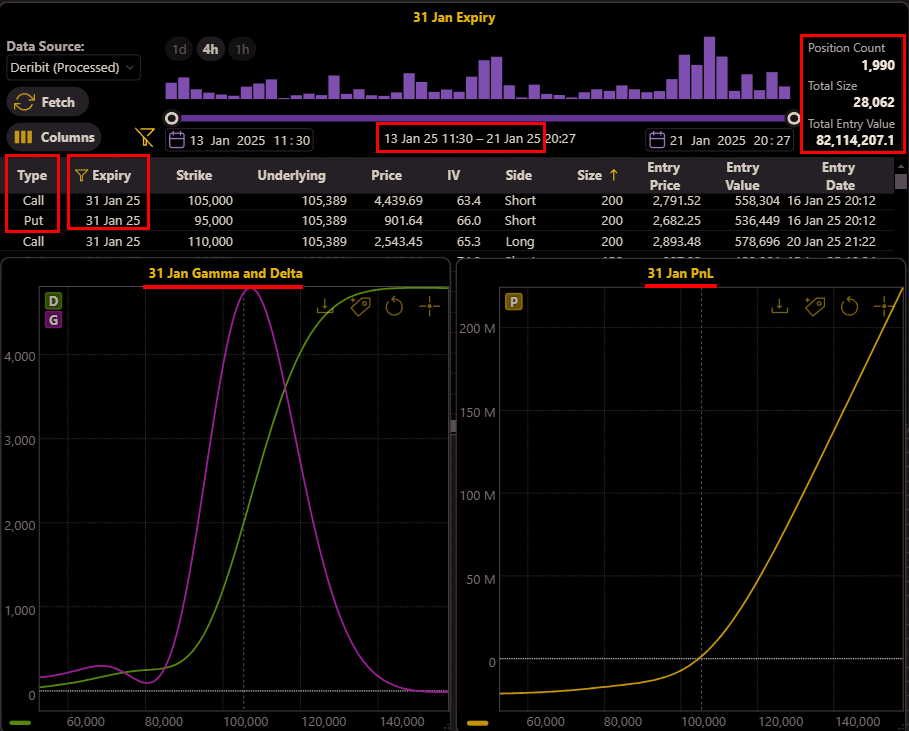
31 Jan
In the same timeframe, traders have demonstrated a bullish outlook for the January 31 expiry.
(OSS)
The overall trades for this expiry resemble a dominant strategy of longing call options, particularly with a strike price near $100,000.
This observation suggests that market participants are optimistic about Bitcoin's price surpassing the $100,000 threshold by the expiry date. Notably, the PnL graph, representing the cumulative market stance, aligns with a bullish bias. Moreover, the Gamma and Delta analysis reveals concentrated long positions around the $100,000 strike, further reinforcing this sentiment.
The willingness of traders to pay a significant premium for these options highlights their confidence in this upward trajectory.
Gamma Squeeze and Market Maker Adjustments
The Gamma for the market, as shown in the left graph above, is clearly long, indicating that traders are primarily holding long options positions. However, this long Gamma implies the opposite stance for market makers, who are naturally short Gamma in their role as counterparties to these trades.
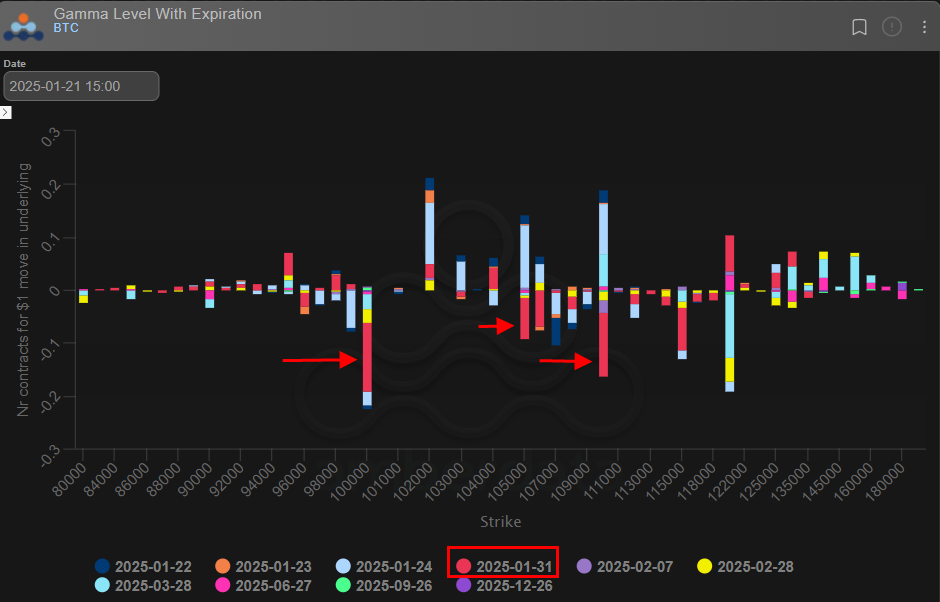
The market makers' short Gamma position is clearly visible in the graph, particularly around key strikes like 100,000, 105,000, and 110,000 highlighted for the 31 January expiry. This means that market makers must actively manage their Delta exposure as the underlying price fluctuates, requiring significant adjustments to their hedges.
These adjustments, necessary for managing short Gamma, can amplify market movements. In essence, as market makers hedge their exposure, their actions can intensify price trends, leading to higher fluctuations. This dynamic, can trigger Gamma Squeeze, a feedback loop that exacerbates volatility, especially around key strikes where short Gamma positions are concentrated.
Bottom Line
As we traced the Bitcoin options market leading up to President Trump's inauguration, a compelling narrative emerged: from heightened volatility and backwardation to the strategic maneuvers of traders and the challenges faced by market makers. Each chart and insight tied together the story of how macro events ripple through the crypto options market, influencing sentiment, strategies, and outcomes.
For those looking to explore these dynamics further, the OSS dashboard offers an unmatched opportunity to dive deep. Test out the Heatmap, analyze positions in the Market Screener, and experiment with strategies to understand these complex market behaviors firsthand.
Stay tuned for more in our Outlook series as we continue to monitor key expiries, uncover market trends, and decode the strategies shaping the ever-evolving Bitcoin options market. Don’t miss the next chapter of this unfolding story!
Try Thales OSS for Simulating your own strategies and Market Analysis.
Disclaimer
The content provided in this blog is for informational and educational purposes only. It does not constitute financial advice, investment recommendations, or an endorsement of any trading strategy. Trading in Bitcoin options involves significant risks, and readers should conduct their own research and consult with a financial advisor before making any decisions.