Introduction
The Bitcoin options market is in a phase of relative calm, with both implied and historical volatility at low levels. In this Outlook, we take a snapshot of key market metrics, including funding rates, open interest, and on-chain activity, to assess trader sentiment. We then analyze recent positioning in the options market, revealing a cautious stance for February but a more optimistic outlook for March. Using OSS tools, we break down how traders are structuring their positions across major expiries.
Market Snapshot
Low IV
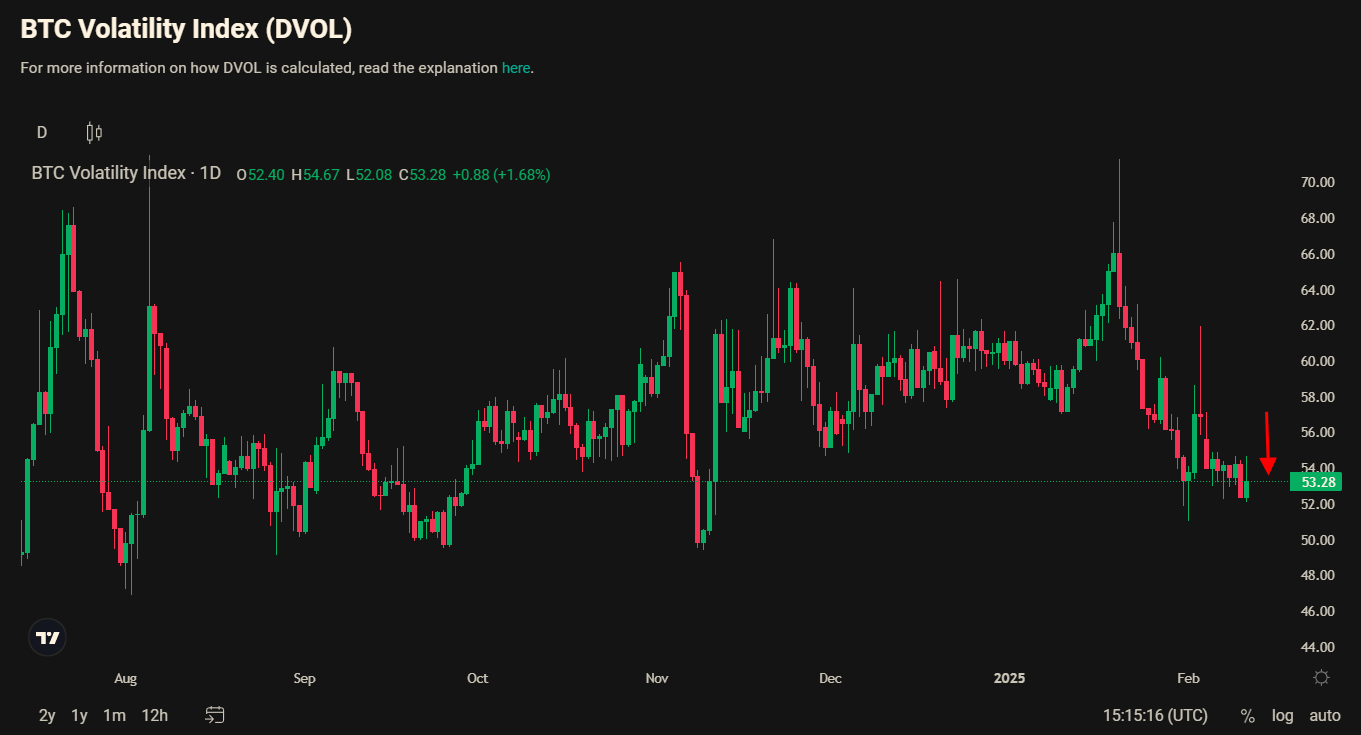
The Bitcoin Volatility Index (DVOL), calculated by Deribit, provides a measure of implied volatility in the Bitcoin options market. After experiencing multiple fluctuations, It currently sits around 50%, which is relatively low.
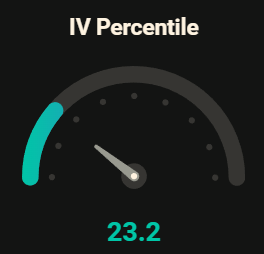
In fact, in the past year, implied volatility has been lower than this level only 23% of the time, making it a notable point of reference. This decline in volatility often suggests reduced trader activity, some traders, however, may view this as an opportunity to buy options.
Historical Volatility
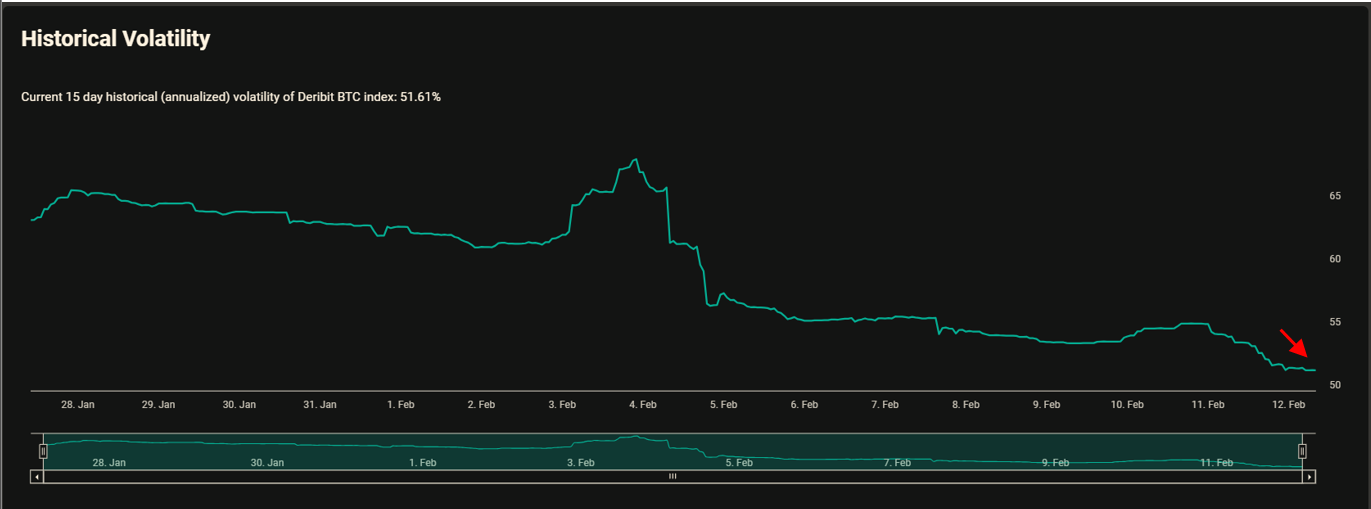
The Historical Volatility of the Bitcoin market, as shown in the chart, is also at a relatively low level. This index, which is calculated on an annualized basis, reflects the actual past price fluctuations in the market, unlike implied volatility (IV), which represents the market’s expectations for future volatility.
Funding Rate
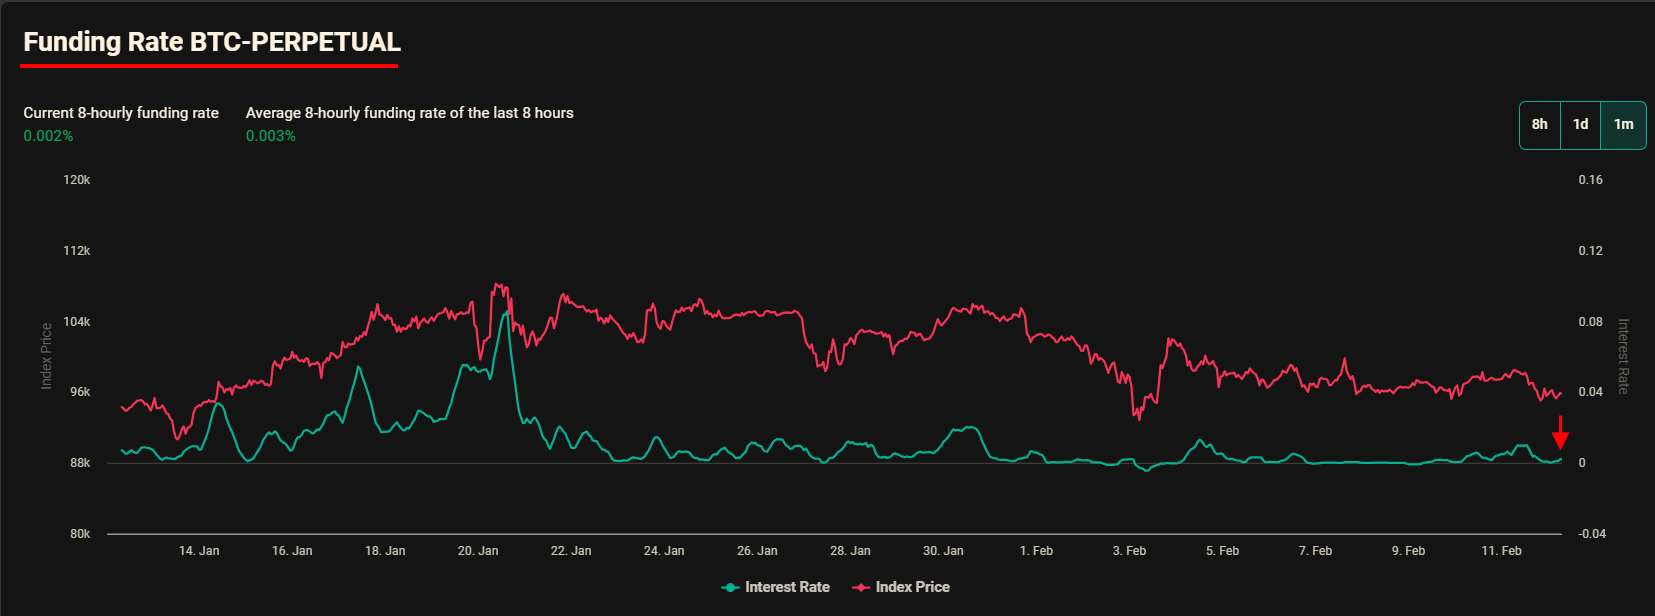
Another key metric that reflects market sentiment, particularly among retail traders, is the funding rate of the perpetual futures market. When the market heats up and traders anticipate a bullish move, many rush into perpetual futures, leveraging their capital to maximize gains. This surge in demand often drives funding rates higher, as the mechanism aims to balance long and short positions by incentivizing short sellers (the process which cannot help by end with a massive liquidation).
Currently, as the charts above indicates, the funding rate is near neutral, indicating a lack of strong directional bias in the market.
OnChain
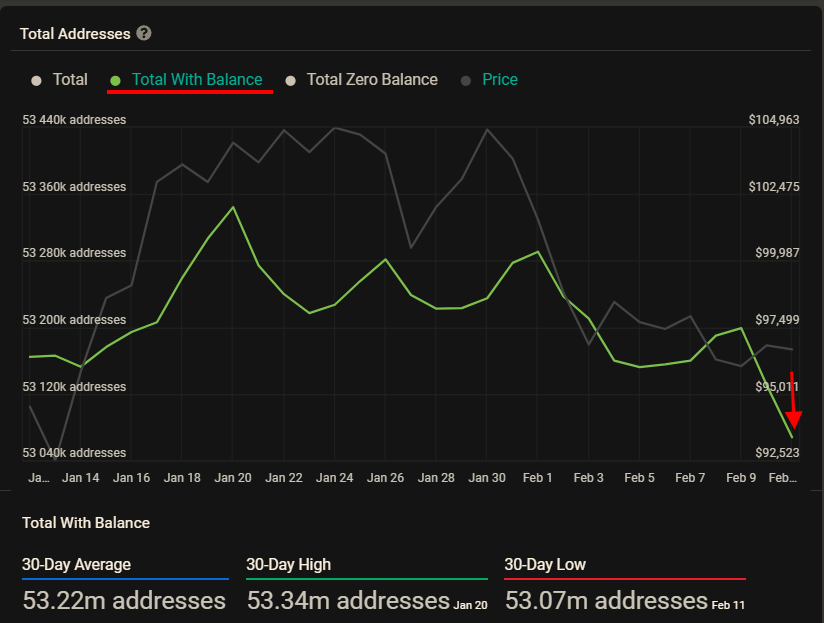
Looking at on-chain data, the number of Bitcoin wallet addresses with a balance has declined, reaching its 30-day low as shown in the chart. This drop may indicate lower activity in the Bitcoin market, suggesting reduced participation from retail or institutional investors.
Open Interest
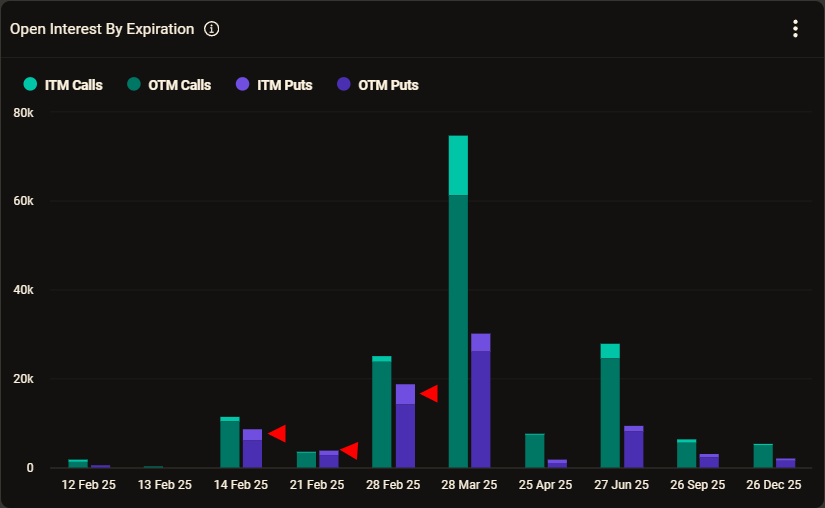
Open Interest (OI) is a key metric reflecting the positioning in the Bitcoin options market. As seen in the chart, the most significant expiry remains 28 March, with over 100,000 open contracts, indicating strong market focus on this date. Call options outnumber puts by roughly 2:1, which is a common trend in Bitcoin options and may suggest an overall bullish sentiment for this expiry.
For shorter-term expiries, such as 14 February and 28 February, OI remains relatively low. However, the put/call ratio is noticeably higher, hinting at a more cautious or bearish near-term sentiment compared to the March expiry.
Market Recent Activities
3 Major Expires on Market Screener
(OSS)
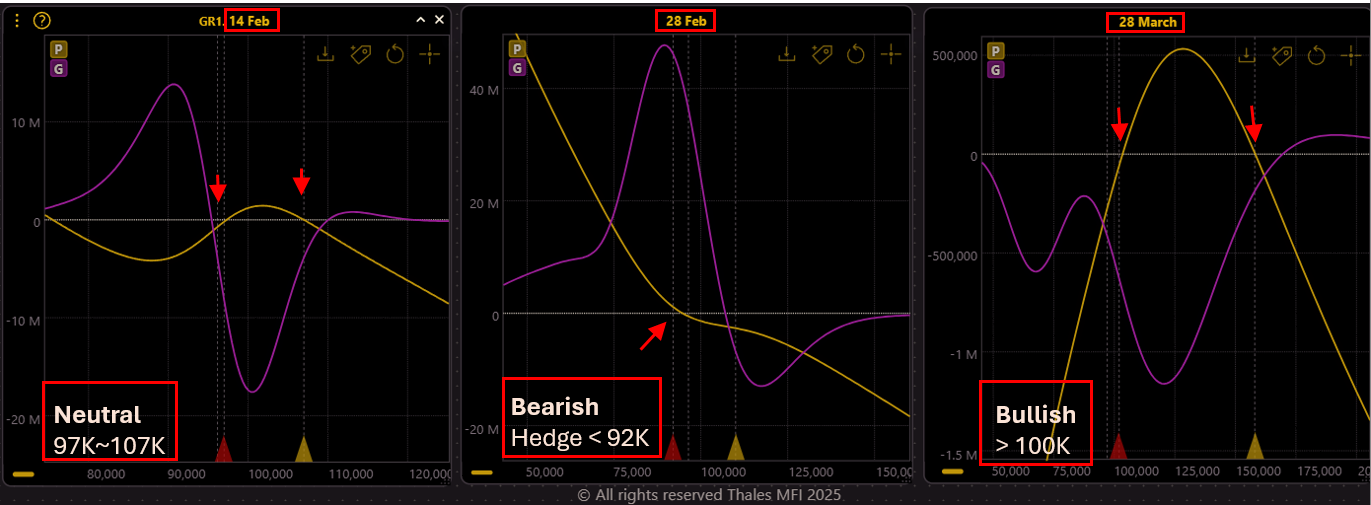
Now, let's take a closer look at the recent activities of Bitcoin options traders. Using the Market Screener, we have filtered trades from the past seven days (4 to 11 February) for the three major expiries discussed earlier: 14 February, 28 February, and 28 March. The graphs above illustrate the PnL profiles of these expiries based on traders’ recent positioning. The yellow curve represents the PnL, while the purple curve shows Gamma, which helps identify the concentrated strike prices (where Gamma peaks) and the side of the market—negative Gamma indicating short positions and positive Gamma suggesting long positions.
14 Feb
(OSS)
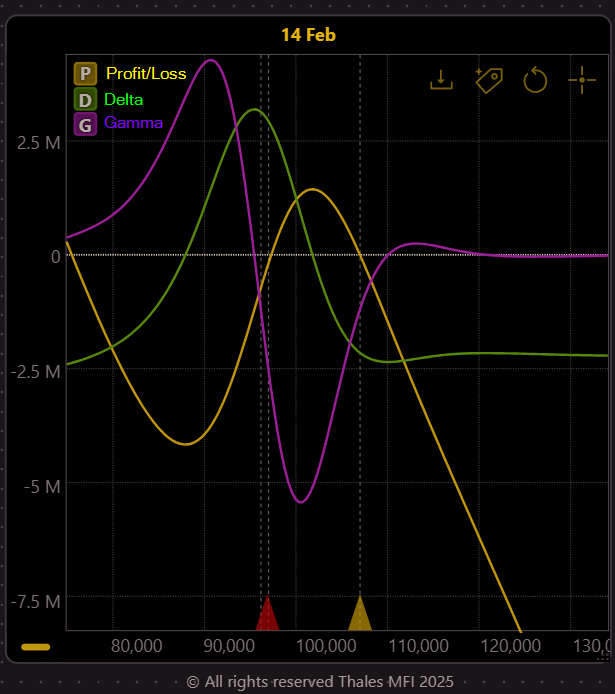
For the 14 February expiry, we analyze the positioning of traders over the past week. The yellow, green, and purple curves in the graph represent PnL, Delta, and Gamma, respectively. The positive Gamma and Delta on the left indicate that traders have established Short put positions, while the negative Gamma and Delta on the right suggest short call positions.
Since Bitcoin's price has remained between $95K and $103K over the past week, and both puts and calls appear to be sold out-of-the-money (OTM), it implies that traders are expecting Bitcoin to remain within this range until the 14 February expiry.
28 Feb
(OSS)
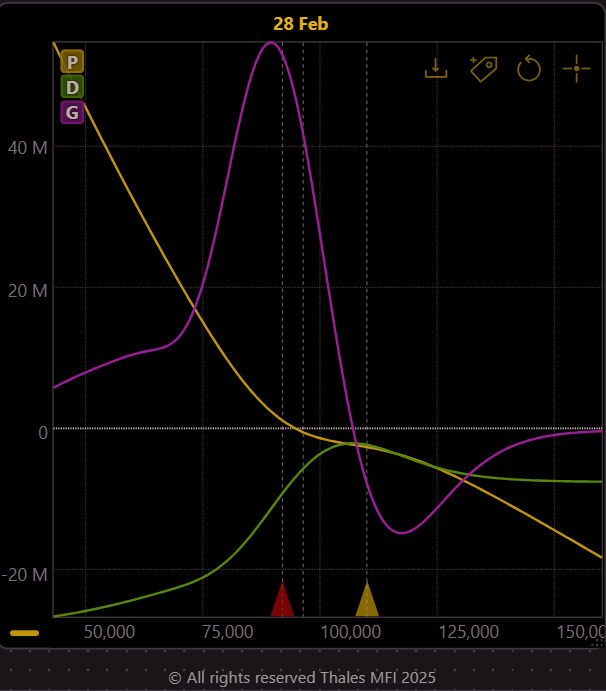
For the 28 February expiry, the chart reveals a strong long put position combined with a lighter short call position over the past week. While a long put position might typically signal a bearish outlook, the overall structure resembles a short risk reversal, which we have examined in previous Outlooks.
Additionally, these long puts could be part of more complex multi-leg strategies, such as calendar put spreads, rather than purely directional bets on downside movement. This means we should interpret the positioning with caution, as it may indicate hedging activity rather than outright bearish sentiment.
28 March
(OSS)
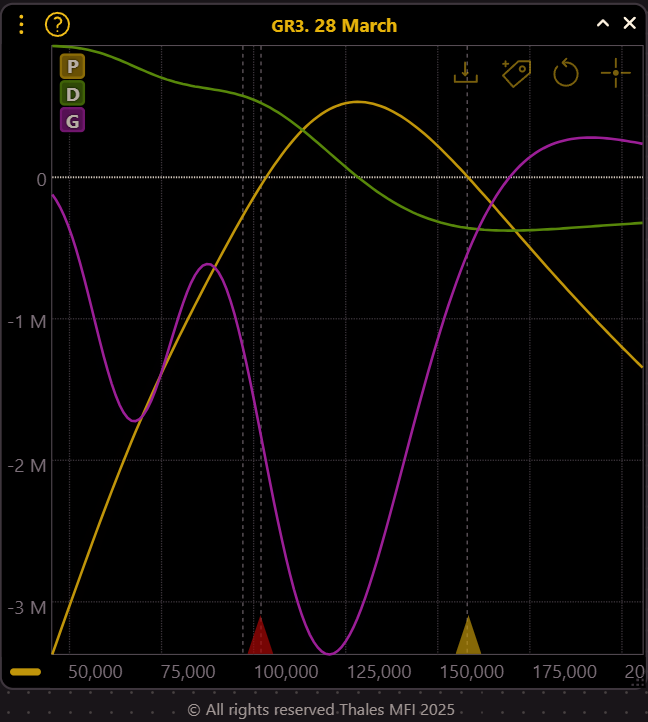
For the 28 March expiry, the overall PnL graph of last week's activities closely resembles a short strangle strategy, typically associated with a neutral market outlook. However, the breakeven levels for this structure appear to be above $150K and below $100K, meaning that beyond these levels, the strategy would start incurring losses.
If we consider this as a collective positioning rather than a single strategy, it suggests that traders might view the range between $100K and $150K as a relatively safe zone to sell options against. In this sense, while the strategy itself is neutral, the implied sentiment appears optimistic, as traders are comfortable taking risk within this wide range.
Bottom Line
While the market remains calm for now, as seen in the Snapshot, both historical and implied volatility are at relatively low levels, and the funding rate is neutral, signaling a lack of strong sentiment, at least in last 7 days.
From our analysis of recent trader activity, using OSS we observed a cautious and bearish stance for February, with more defensive positioning in the short term. However, as we move toward March, traders appear more optimistic, with positioning suggesting a broader and more confident market outlook.
That said, the market is dynamic—volatility can return at any moment, rapidly shifting sentiment and positioning. Stay tuned for future Outlooks on the Thales website to track how traders adapt and how market conditions evolve.
Disclaimer
This report is for informational purposes only and does not constitute financial advice. Options trading involves risk, and past market activity does not guarantee future performance. Traders should conduct their own research and assess their risk tolerance before making any investment decisions.