Introduction: Volatility Strikes Back
The Bitcoin options market has awakened. After weeks of stagnation and declining implied volatility (IV), the past ten days have seen a dramatic reversal. IV has surged from 48 to over 60, a move that coincides with Bitcoin losing its $90,000 support level. Traders are paying a premium for protection, and options pricing has adjusted sharply to reflect the new reality.
This renewed turbulence isn’t happening in isolation. A combination of macroeconomic and market-specific catalysts—ranging from the $1.5 billion Bybit hack to escalating U.S. trade tensions—has added fuel to the fire. The result? A rapidly shifting landscape where hedging activity is intensifying, and positioning in upcoming expiries is taking on a more defensive tone.
With the March 7 expiry behind us, we now turn our attention to March 14, where a notable build-up in put open interest suggests growing concern among traders. At the same time, recent trading activity in our Market Screener reveals institutional footprints, including a large Put Calendar Spread and an aggressive short risk reversal strategy—both indicating that major players are actively bracing for potential downside.
As we dive into this week’s outlook, the key question is whether this wave of hedging signals true fear—or just prudent risk management. Let’s break it down.
Market Snapshot
Volatility Returns to the Bitcoin Options Market
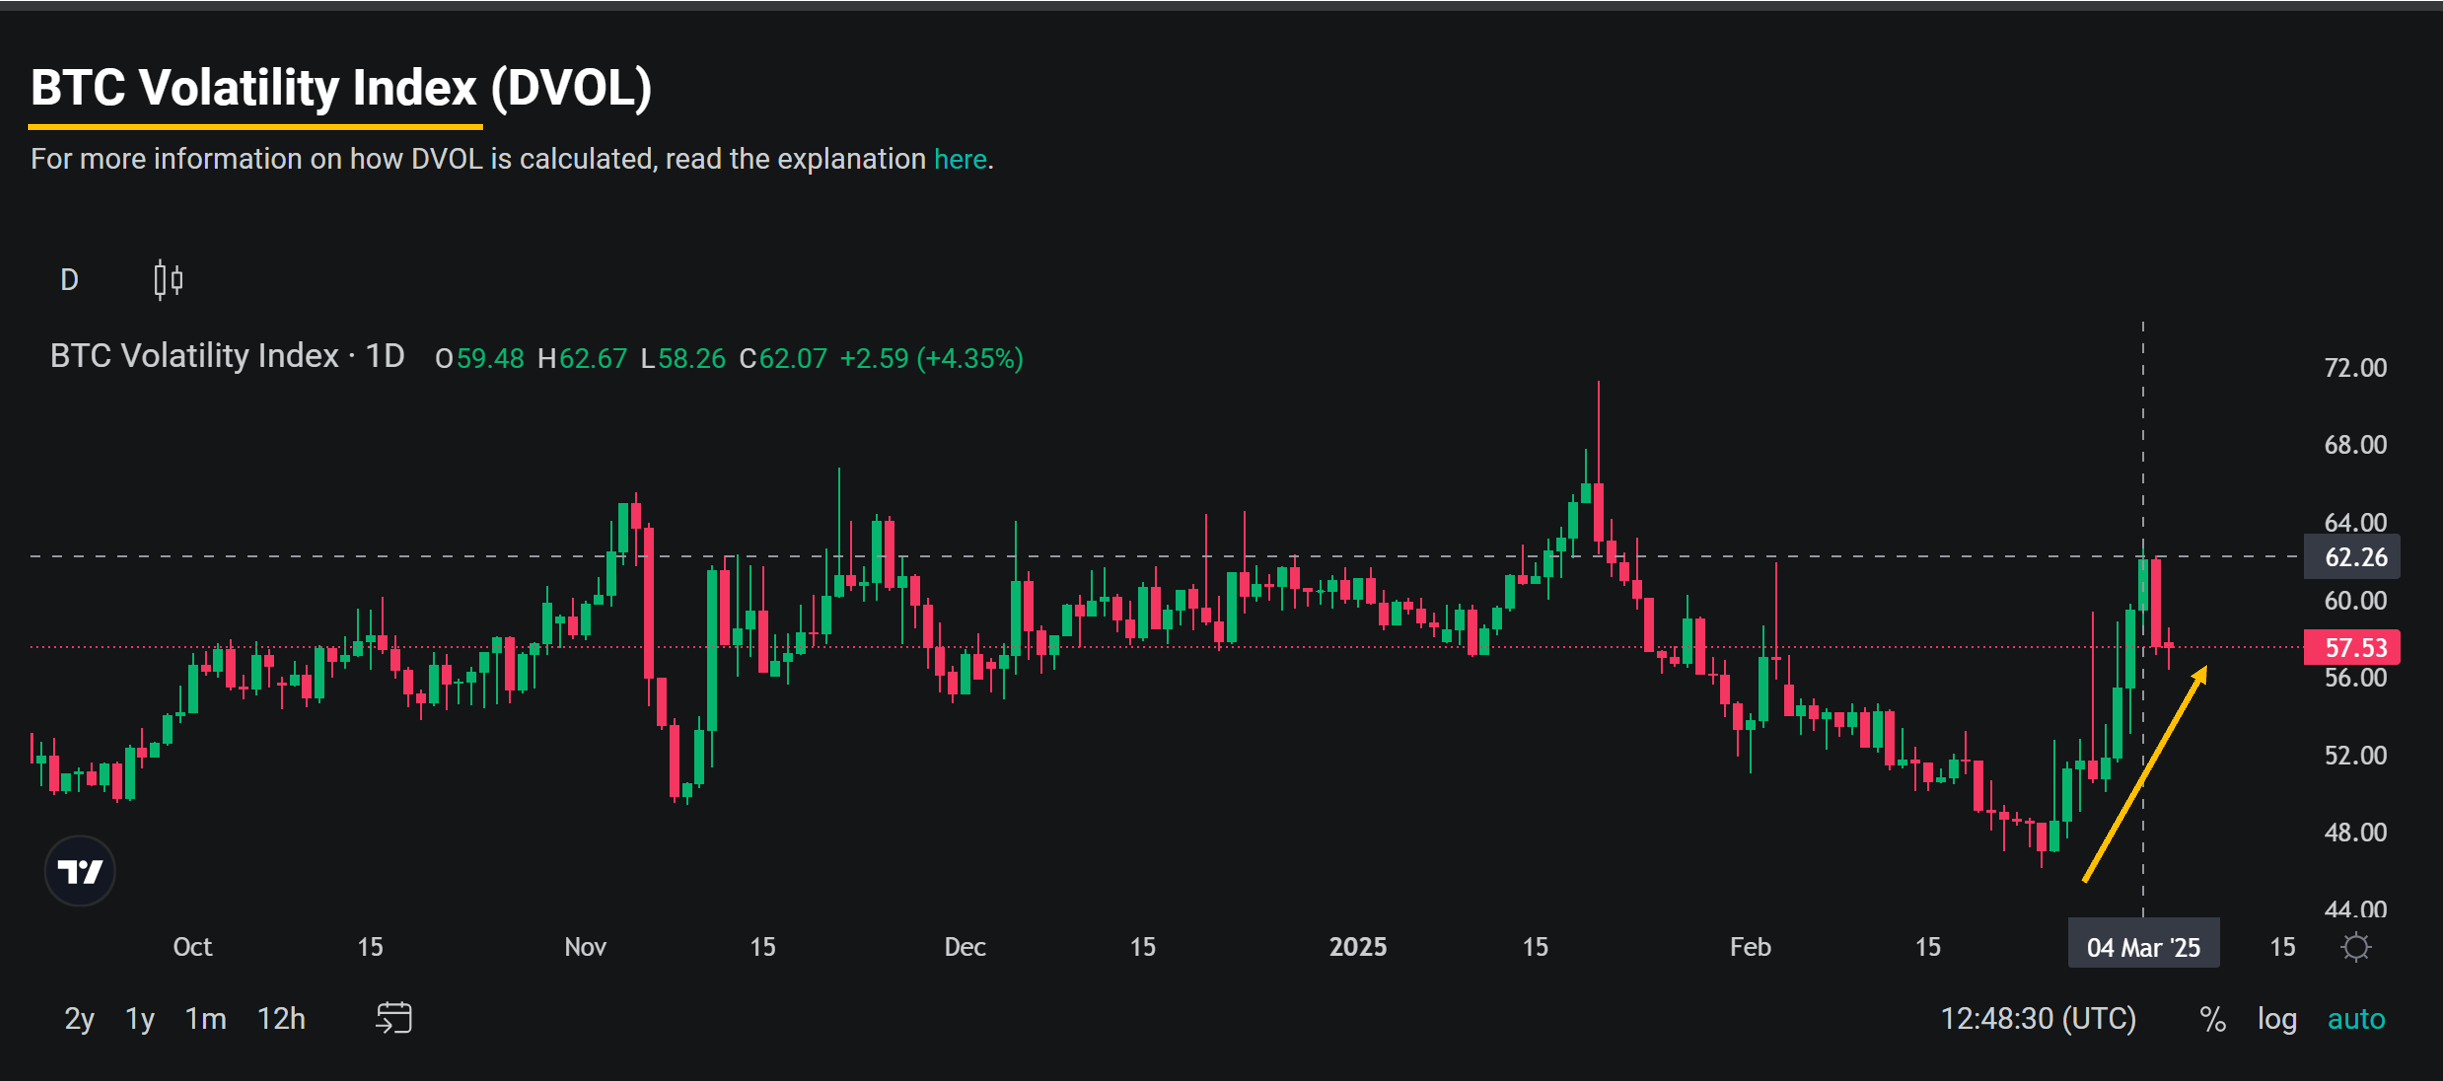
After a prolonged period of stagnation in the options market—reflected in historically low implied volatility (IV)—we’ve now seen a sharp rebound. Over the past ten days, IV has risen from 48 back toward the mid-channel around 60, signaling a renewed shift in market sentiment.
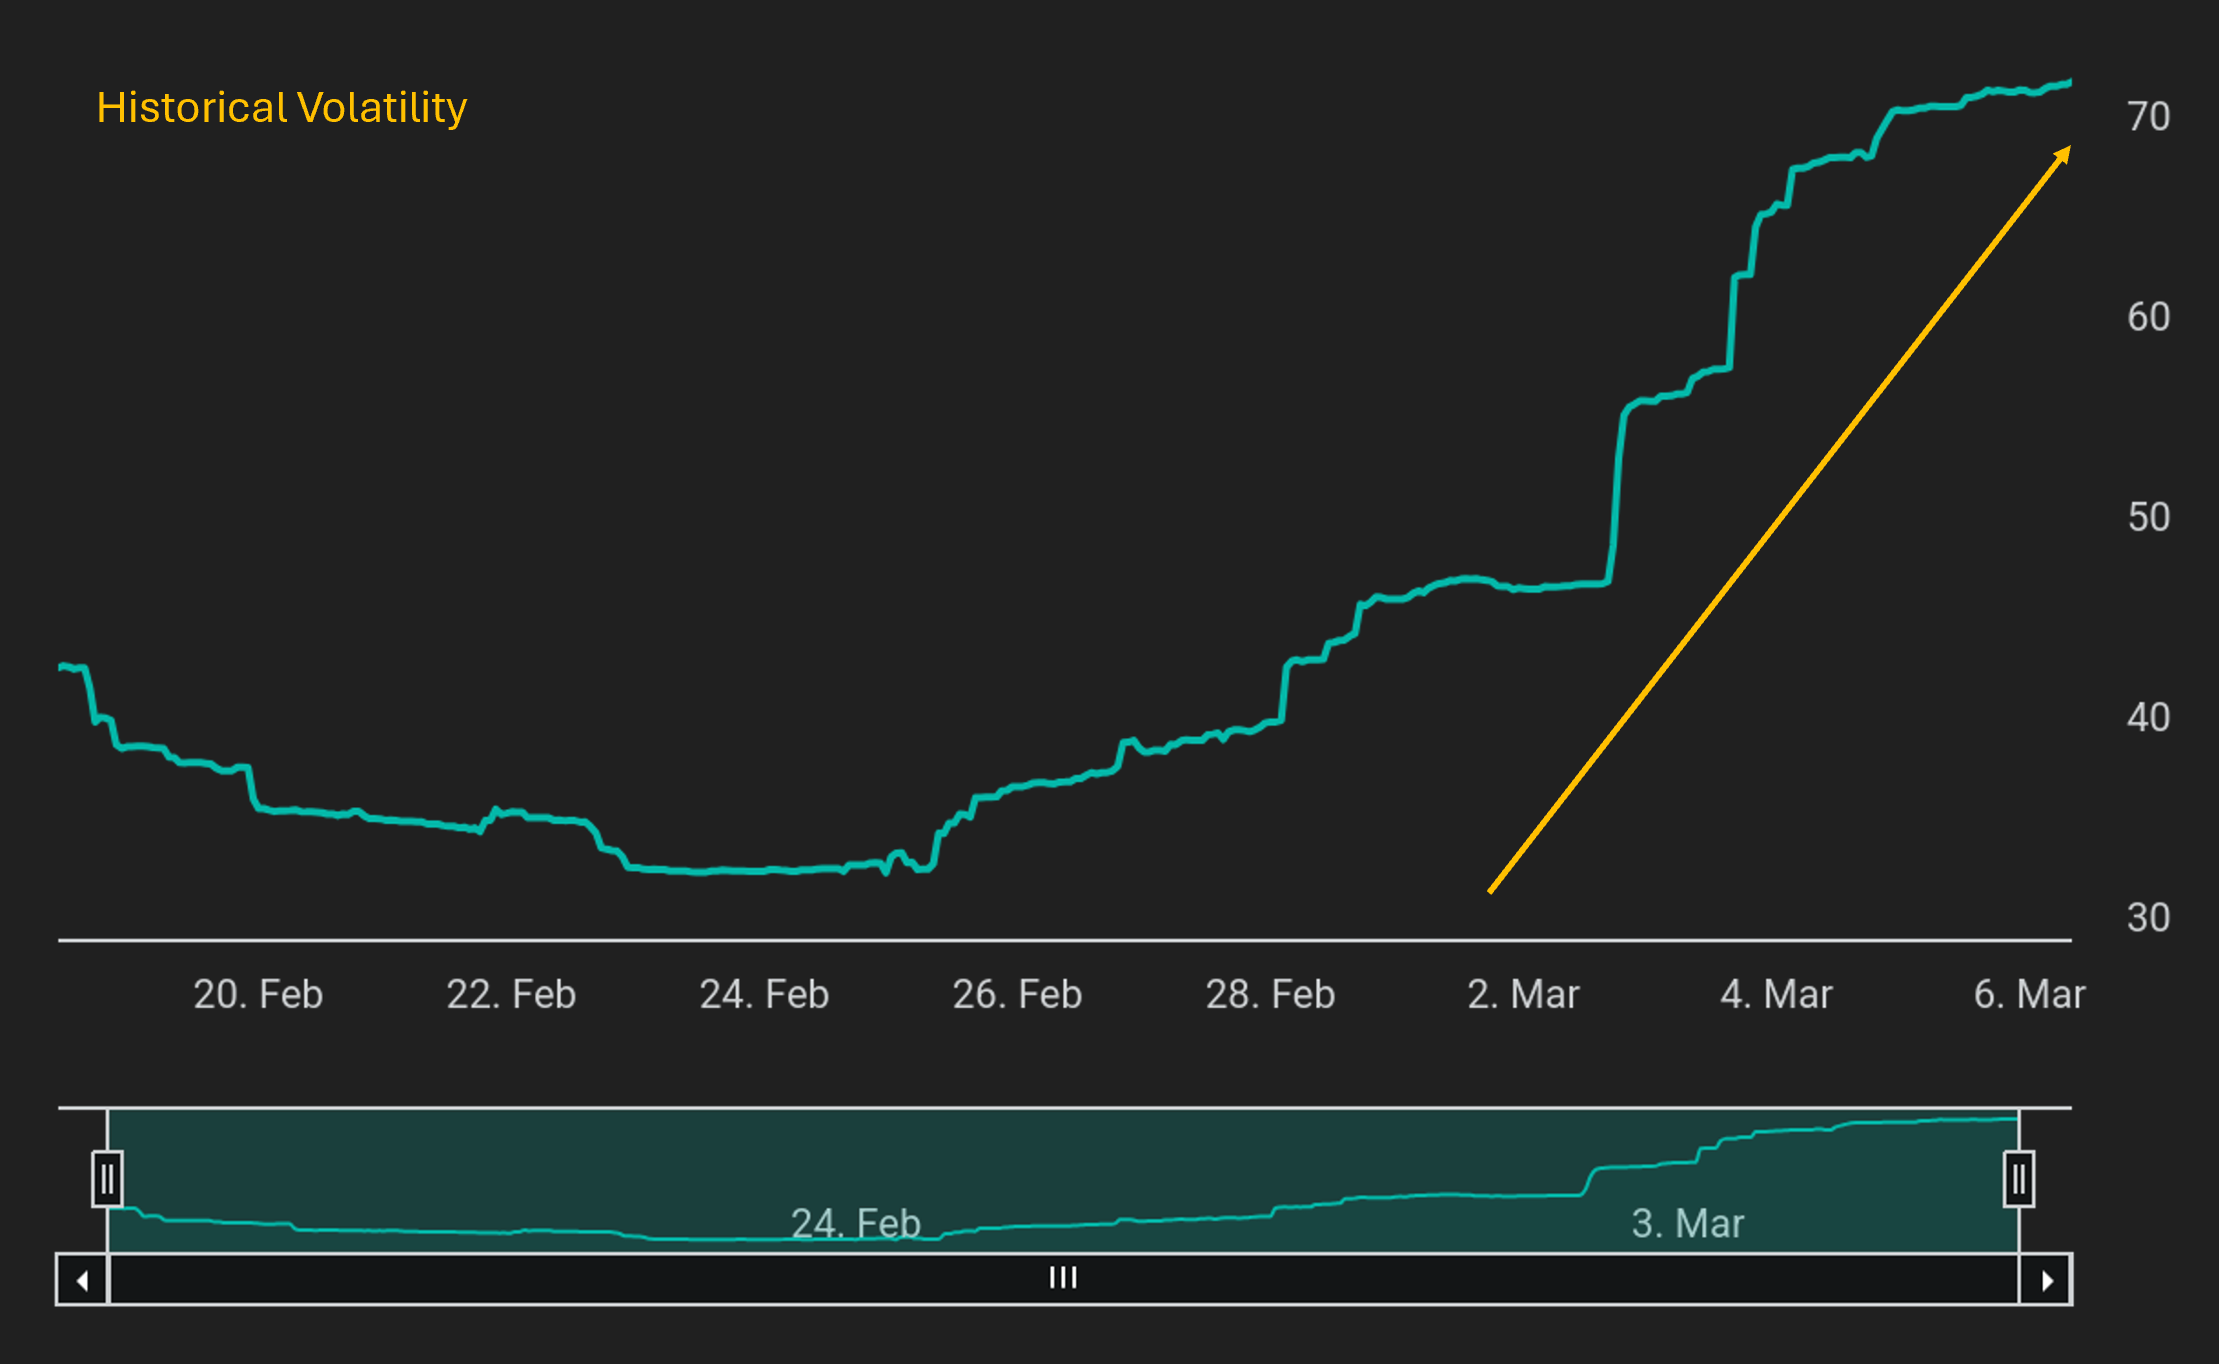
This increase is also evident in historical volatility, which has climbed toward 70, reinforcing the shift in market conditions (see the chart below).
A closer look at Bitcoin’s price action suggests that this IV surge coincided with the loss of the critical $90,000 support level.
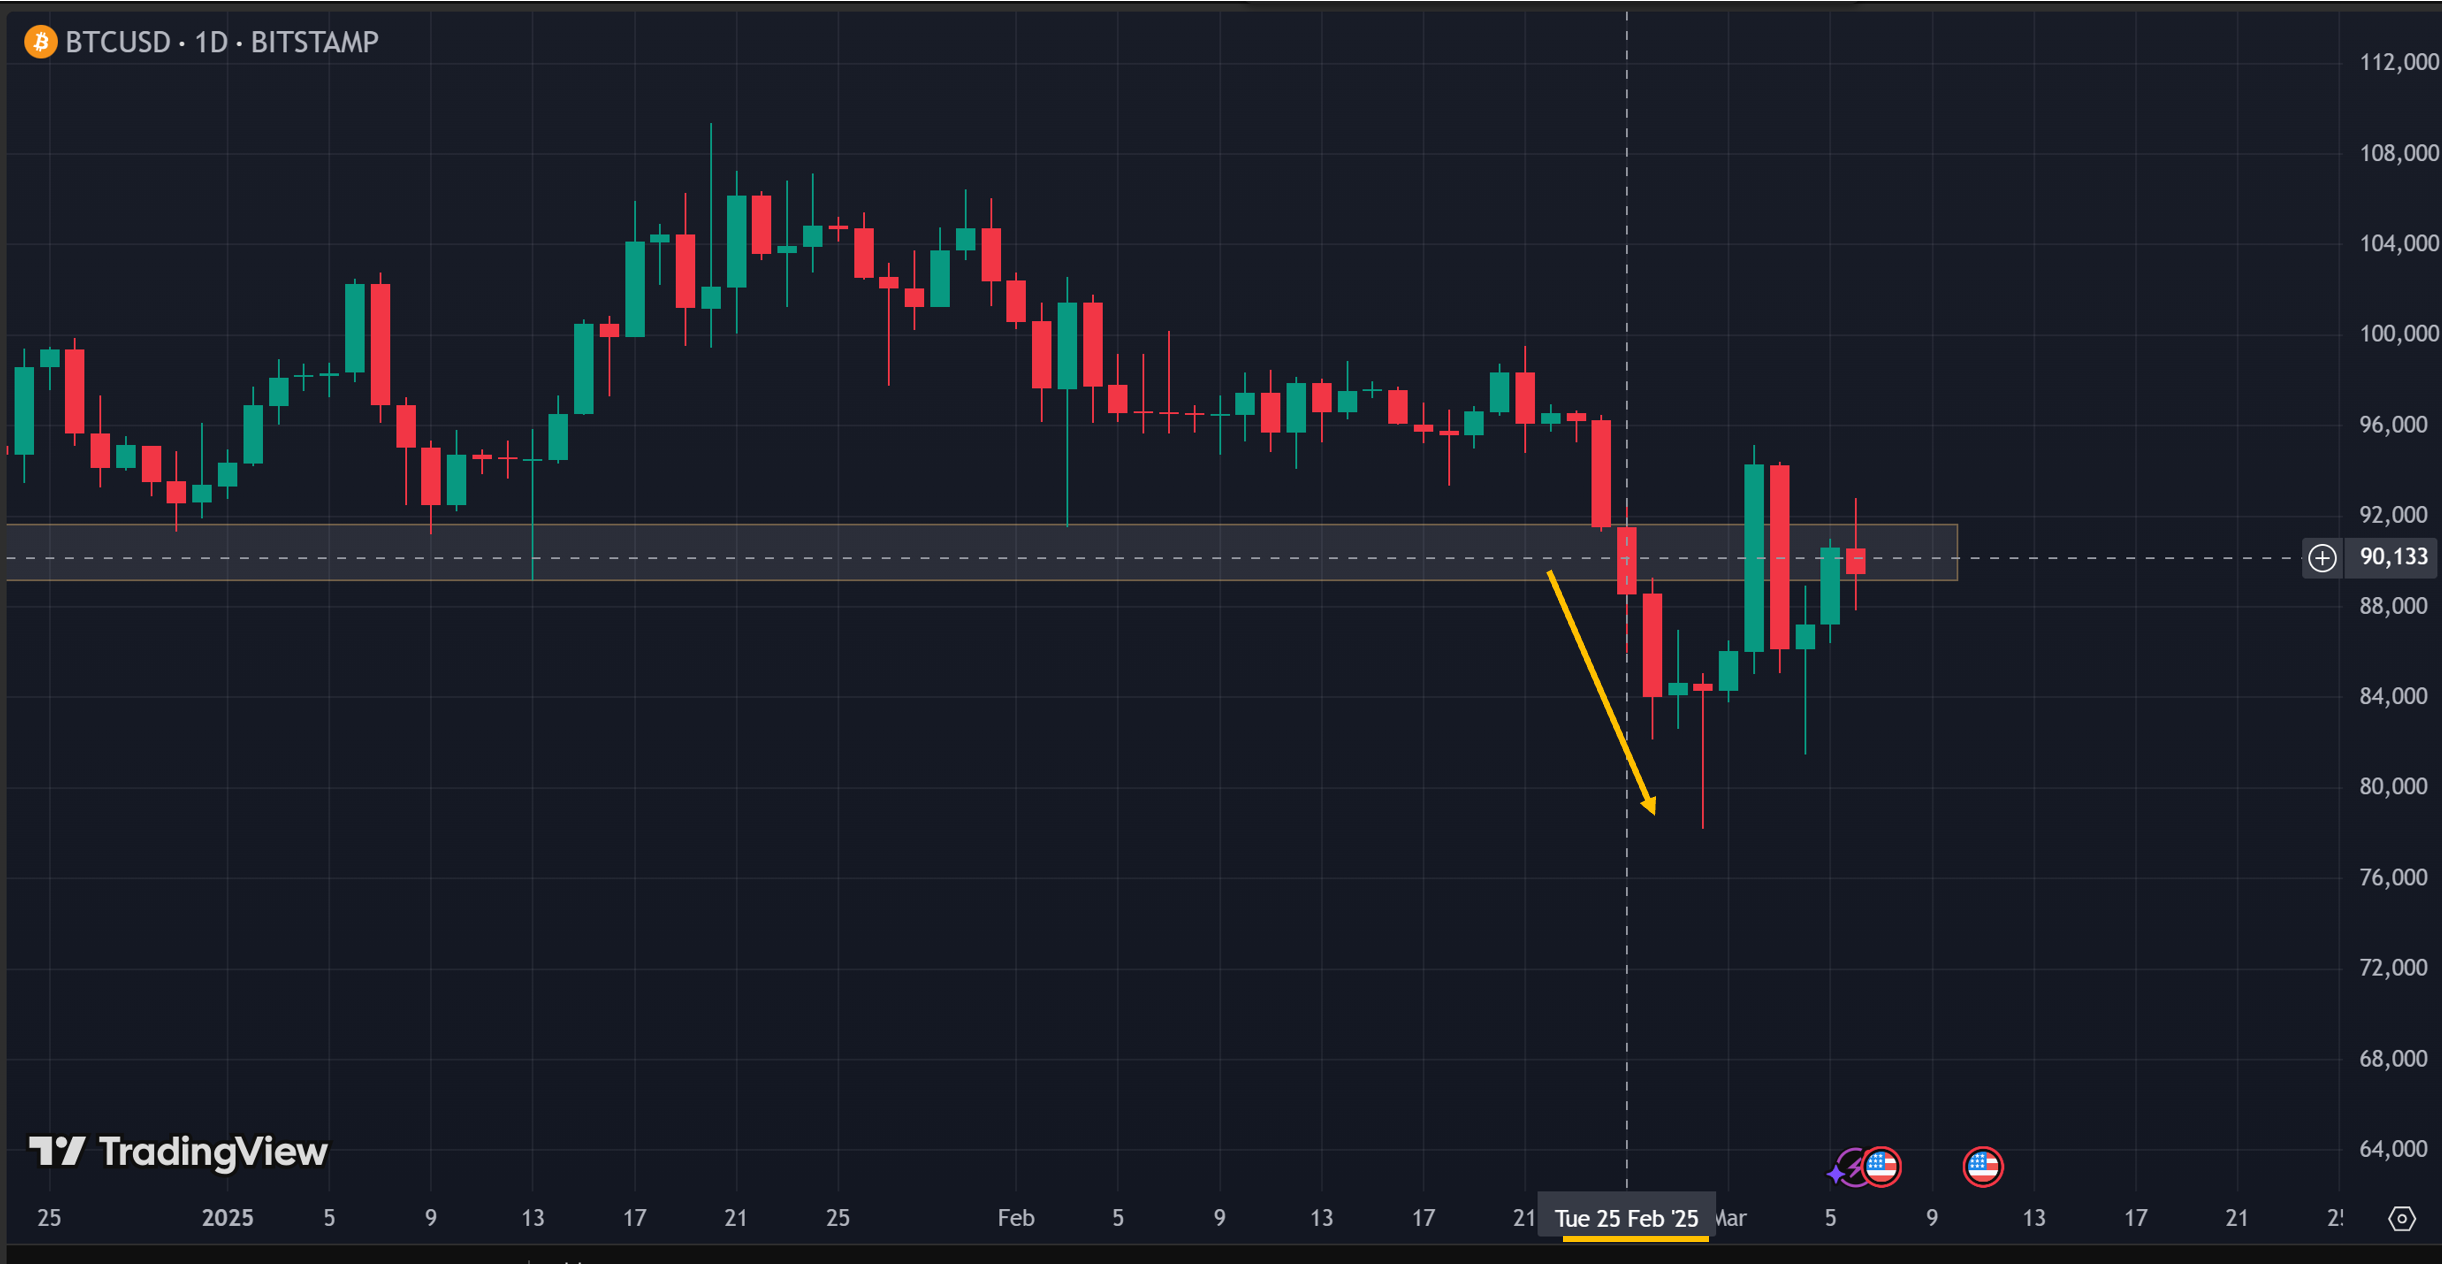
While multiple factors may have contributed—such as the recent $1.5 billion theft from Bybit and ongoing U.S. government tariff actions—the impact on options pricing is clear: premiums are rising, making Bitcoin options more expensive.
7 March Expired Near Max pain
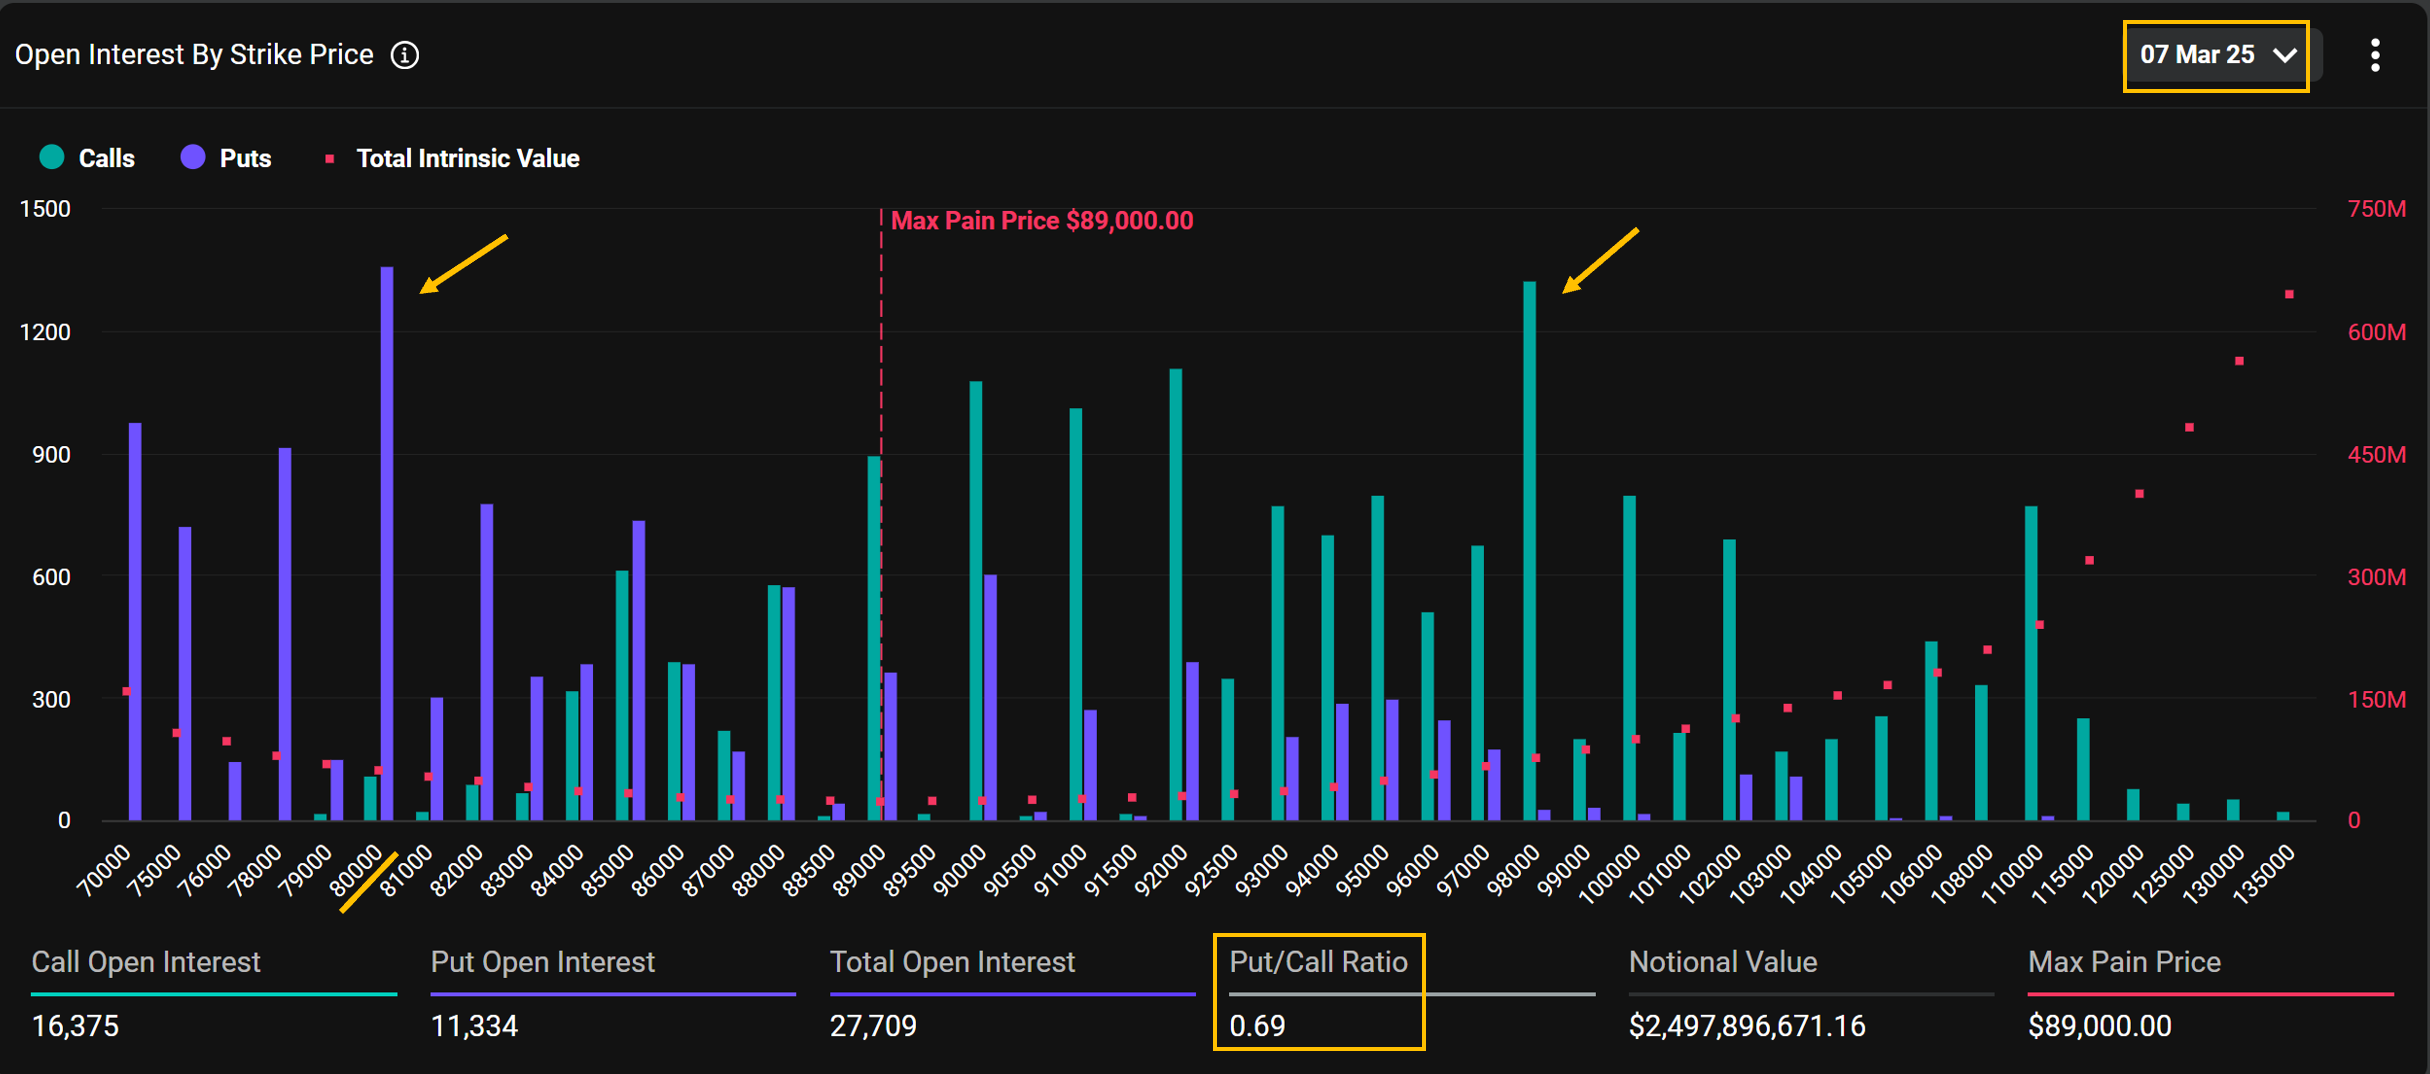
The March 7 options expiry has now concluded, with contracts settling at $88,300 on Deribit. Notably, this is very close to the Max Pain price of $89,000, the level where the fewest contracts expire in-the-money. Once again, the final price landed in favor of options sellers, as a significant portion of both puts and calls expired worthless.
Puts with strikes below $88,000, including $80,000, down to $70,000, along with calls from $90,000 up to $98,000 and beyond, failed to hold any value at expiration.
The Put/Call ratio stood at 69%, indicating a relatively high concentration of put contracts, likely reflecting the recent uncertainty in the market.
In total, around $2.5 billion in notional value mostly expired out of the money. With this expiry behind us, attention now shifts to upcoming expirations and how traders are positioning in the next market cycle.
Next Expiries
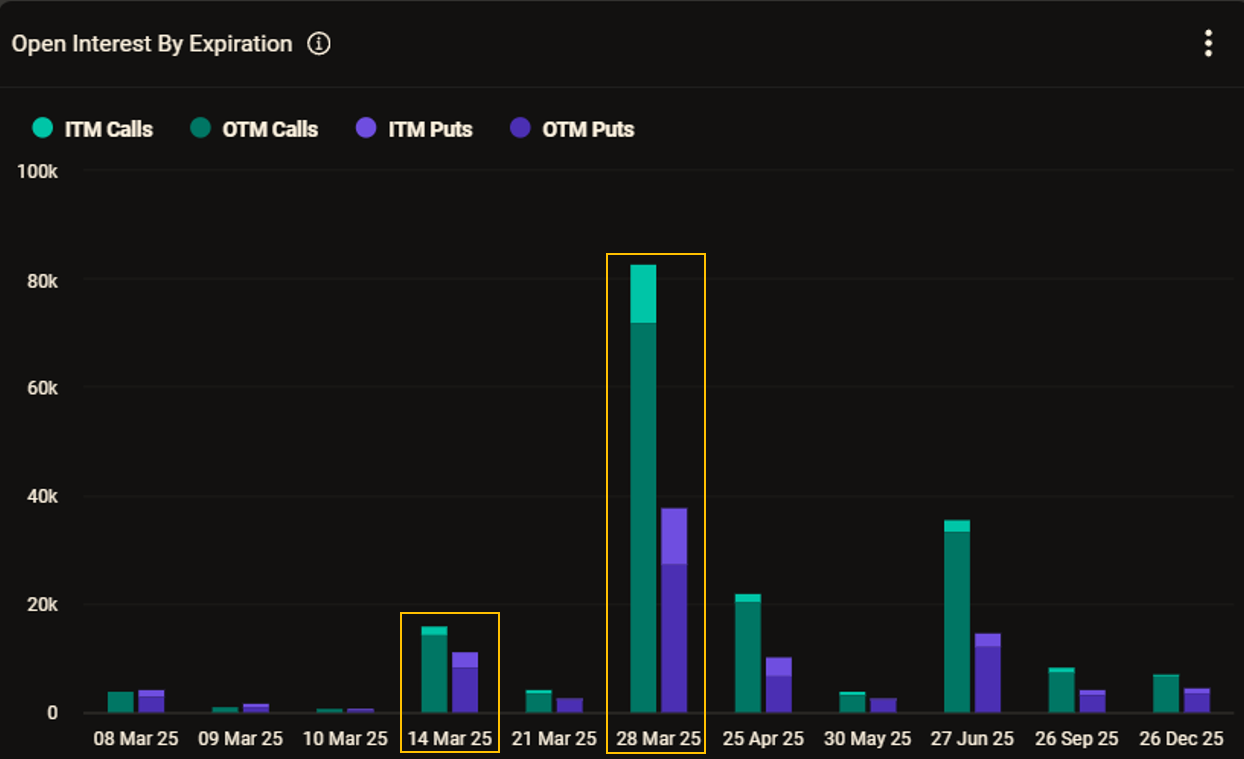
Beyond the quarterly maturities of 28 March and 27 June, the 14 March expiry stands out with relatively significant open interest, signaling increased trader activity in the short term.
14 March
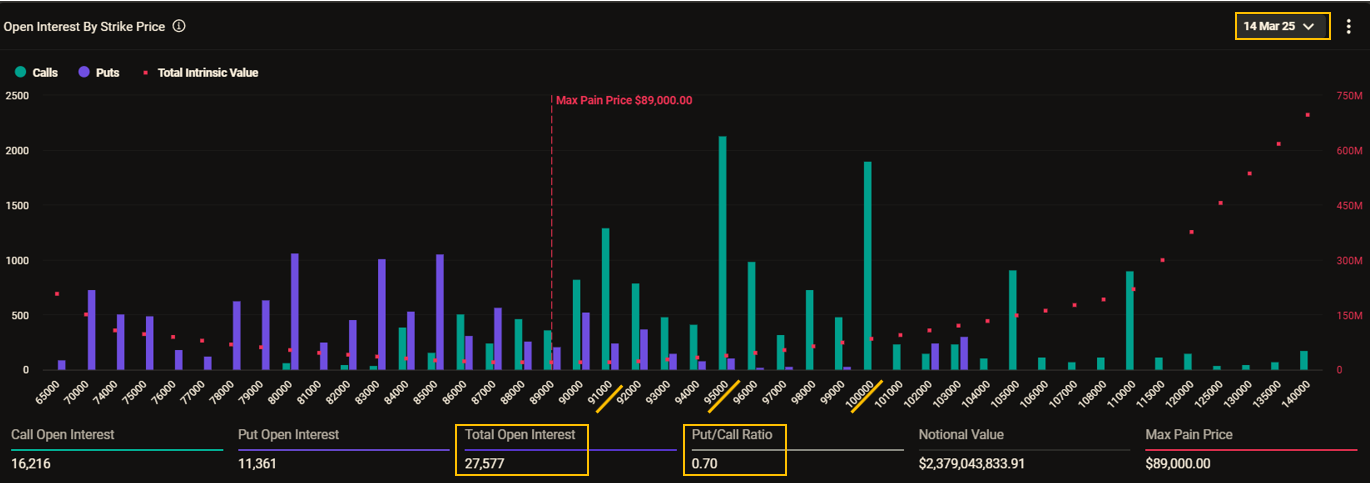
Despite a relatively high put/call ratio of 0.7, the chart does not yet indicate strong fear in the market. Notably, several out-of-the-money (OTM) call options, such as those at $91,000, $95,000, and $100,000, hold significant open interest, suggesting traders are still considering the upside potential.
Meanwhile, puts with notable open interest are mostly far OTM (e.g., $85,000 and below), which points more toward moderate hedging rather than outright panic.
For now, the positioning appears balanced, but it will be crucial to monitor how this evolves as we approach next Friday’s expiration.
Recent Activities
Near Fear
(OSS)
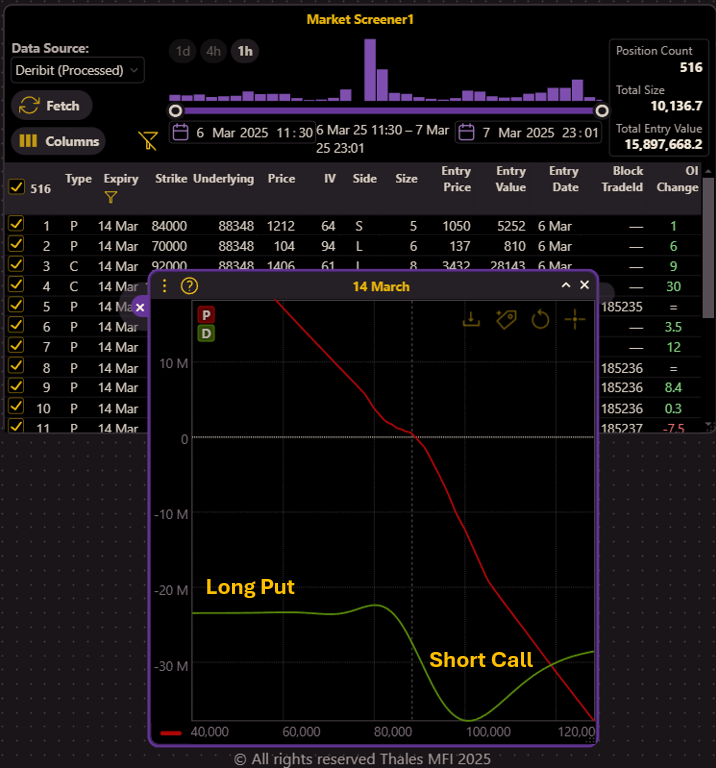
Beyond the broader market snapshot, recent trading activity in Bitcoin options reveals a shift in sentiment following macroeconomic developments. With the ongoing tariff war and reports of U.S. President Donald Trump signing an executive order to establish a strategic reserve of cryptocurrencies, traders appear to be adjusting their positions in anticipation of increased volatility.
To assess this reaction, we filtered our Market Screener for the 14 March expiry and analyzed trades from the past 48 hours. The aggregated PnL curve (red) strongly resembles a short risk reversal strategy, combining long put positions and short calls near the current Bitcoin price.
By examining the delta curve (green), we can see that the structure aligns with a ratio risk reversal, where long puts outweigh short calls nearly 2-to-1. This strategy is bearish and primarily serves as a hedge against downside risk, indicating that traders are preparing for potential price corrections ahead of next Friday's expiration.
Blocked Trade Footprint: A Large Put Calendar Spread Spotted in the Market
(OSS)
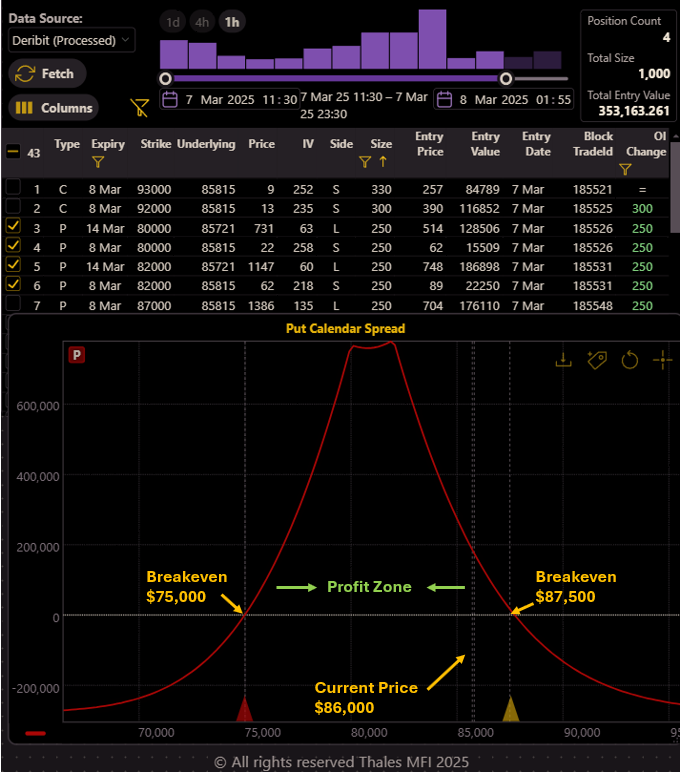
Among the recent trades captured in our Market Screener, we identified a notable Put Calendar Spread executed by Block traders.
Filtering the Market Screener for Big Players
To isolate significant trades, we applied the following filters:
- Entry Date: March 7, capturing only the most recent trades.
- Expiry Selection: Short-term strategies within March.
- Trade Size: Greater than 50 contracts, ensuring institutional-level activity.
- Block Trades Only: Filtering out retail noise.
Through this filtering, we spotted two block traders, each executing a 250-contract position, forming two nearly identical Put Calendar Spreads with strike prices of $80,000 and $82,000.
Breaking Down the Strategy
Each of these Put Calendar Spreads consists of:
- Long OTM puts (14 March expiry, 7 DTE)
- Short OTM puts (8 March expiry, 1 DTE, now expired)
This structure is moderately bearish, with the profit zone spanning between two breakeven points: $87,500 and $75,000. Unlike aggressively directional bearish strategies, this trade profits from a controlled price decline or increased implied volatility (IV) rather than a sharp sell-off.
If Bitcoin price decreases sharply, the earlier 1DTE short put would expire ITM, generating a loss. However, this is offset by the long put's gain, which retains more extrinsic value due to its longer DTE. For the strategy to remain profitable, Bitcoin should not fall below $75,000.
If the short put expires OTM, the trader can sell another short put for a later 1DTE expiry, rolling the structure forward while collecting additional premium.
Bottom Line: A Market in Transition
The Bitcoin options market has entered a new phase, marked by rising implied volatility and shifting trader sentiment. After weeks of stagnation, IV has climbed back toward mid-channel levels, making options more expensive and signaling renewed uncertainty.
The March 7 expiry settled near Max Pain at $88,300, with a significant portion of both puts and calls expiring worthless. This expiration favored options sellers, and with $2.5 billion in notional value now off the table, focus turns to upcoming expirations—especially March 14, where positioning remains balanced but leans cautiously bearish.
Recent activity in the Market Screener reveals institutional hedging, with short risk reversal strategies and large put calendar spreads emerging as dominant themes. Traders appear to be preparing for potential downside while leaving room for IV-driven opportunities.
As we approach the next expiration, the market remains in flux. The coming days will determine whether traders' hedges were well-placed—or if sentiment shifts once again.
Disclaimer
This report is for informational purposes only and does not constitute financial advice. Options trading involves significant risk, and past performance is not indicative of future results. Readers should conduct their own research and consult with a professional before making any investment decisions.