Introduction
As Bitcoin consolidates below all-time highs, the options market reveals a shift beneath the surface. The March 28 expiry, which dominated open interest, has passed—leaving behind a trail of expired optimism and a growing appetite for downside protection. This week’s Outlook dissects how traders have repositioned: from aggressive calls to defensive puts, from short-term uncertainty to long-term caution.
We explore where the open interest has moved, what the rise in implied volatility signals, and how skew is reflecting mounting fear. Beyond the aggregate data, we dive into specific trader behavior, including one large call ratio spread that offers a window into market expectations for the weeks ahead.
Whether you're managing risk or seeking opportunity, this Outlook captures the changing psychology of the Bitcoin options market—one data point at a time.
Explore these market dynamics firsthand with the Thales Options Strategy Simulator (OSS)
Market Snapshot
140K Contracts Expire—Most Left OTM
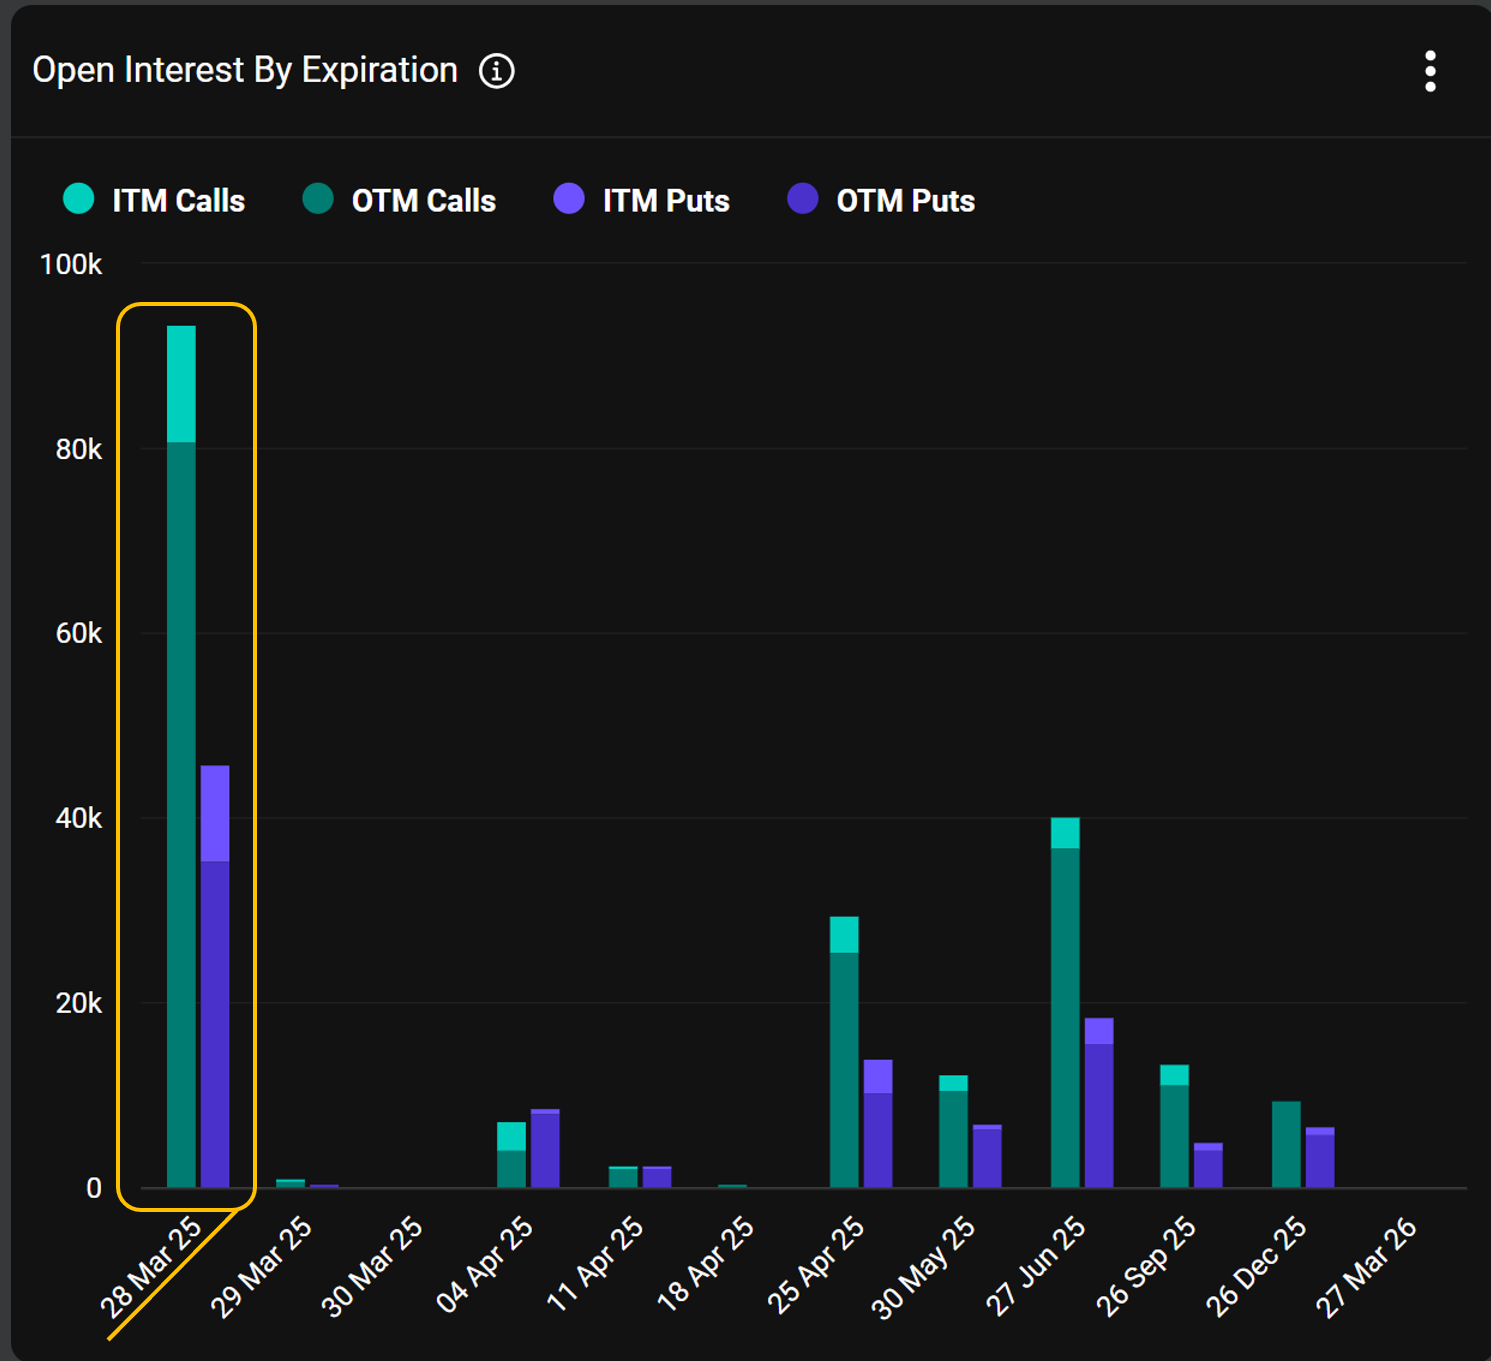
The March 28 expiry stood out as the dominant expiration in the Bitcoin options market, holding the highest open interest by a wide margin. However, despite this heavy positioning, only a small portion of contracts ended in-the-money (ITM).
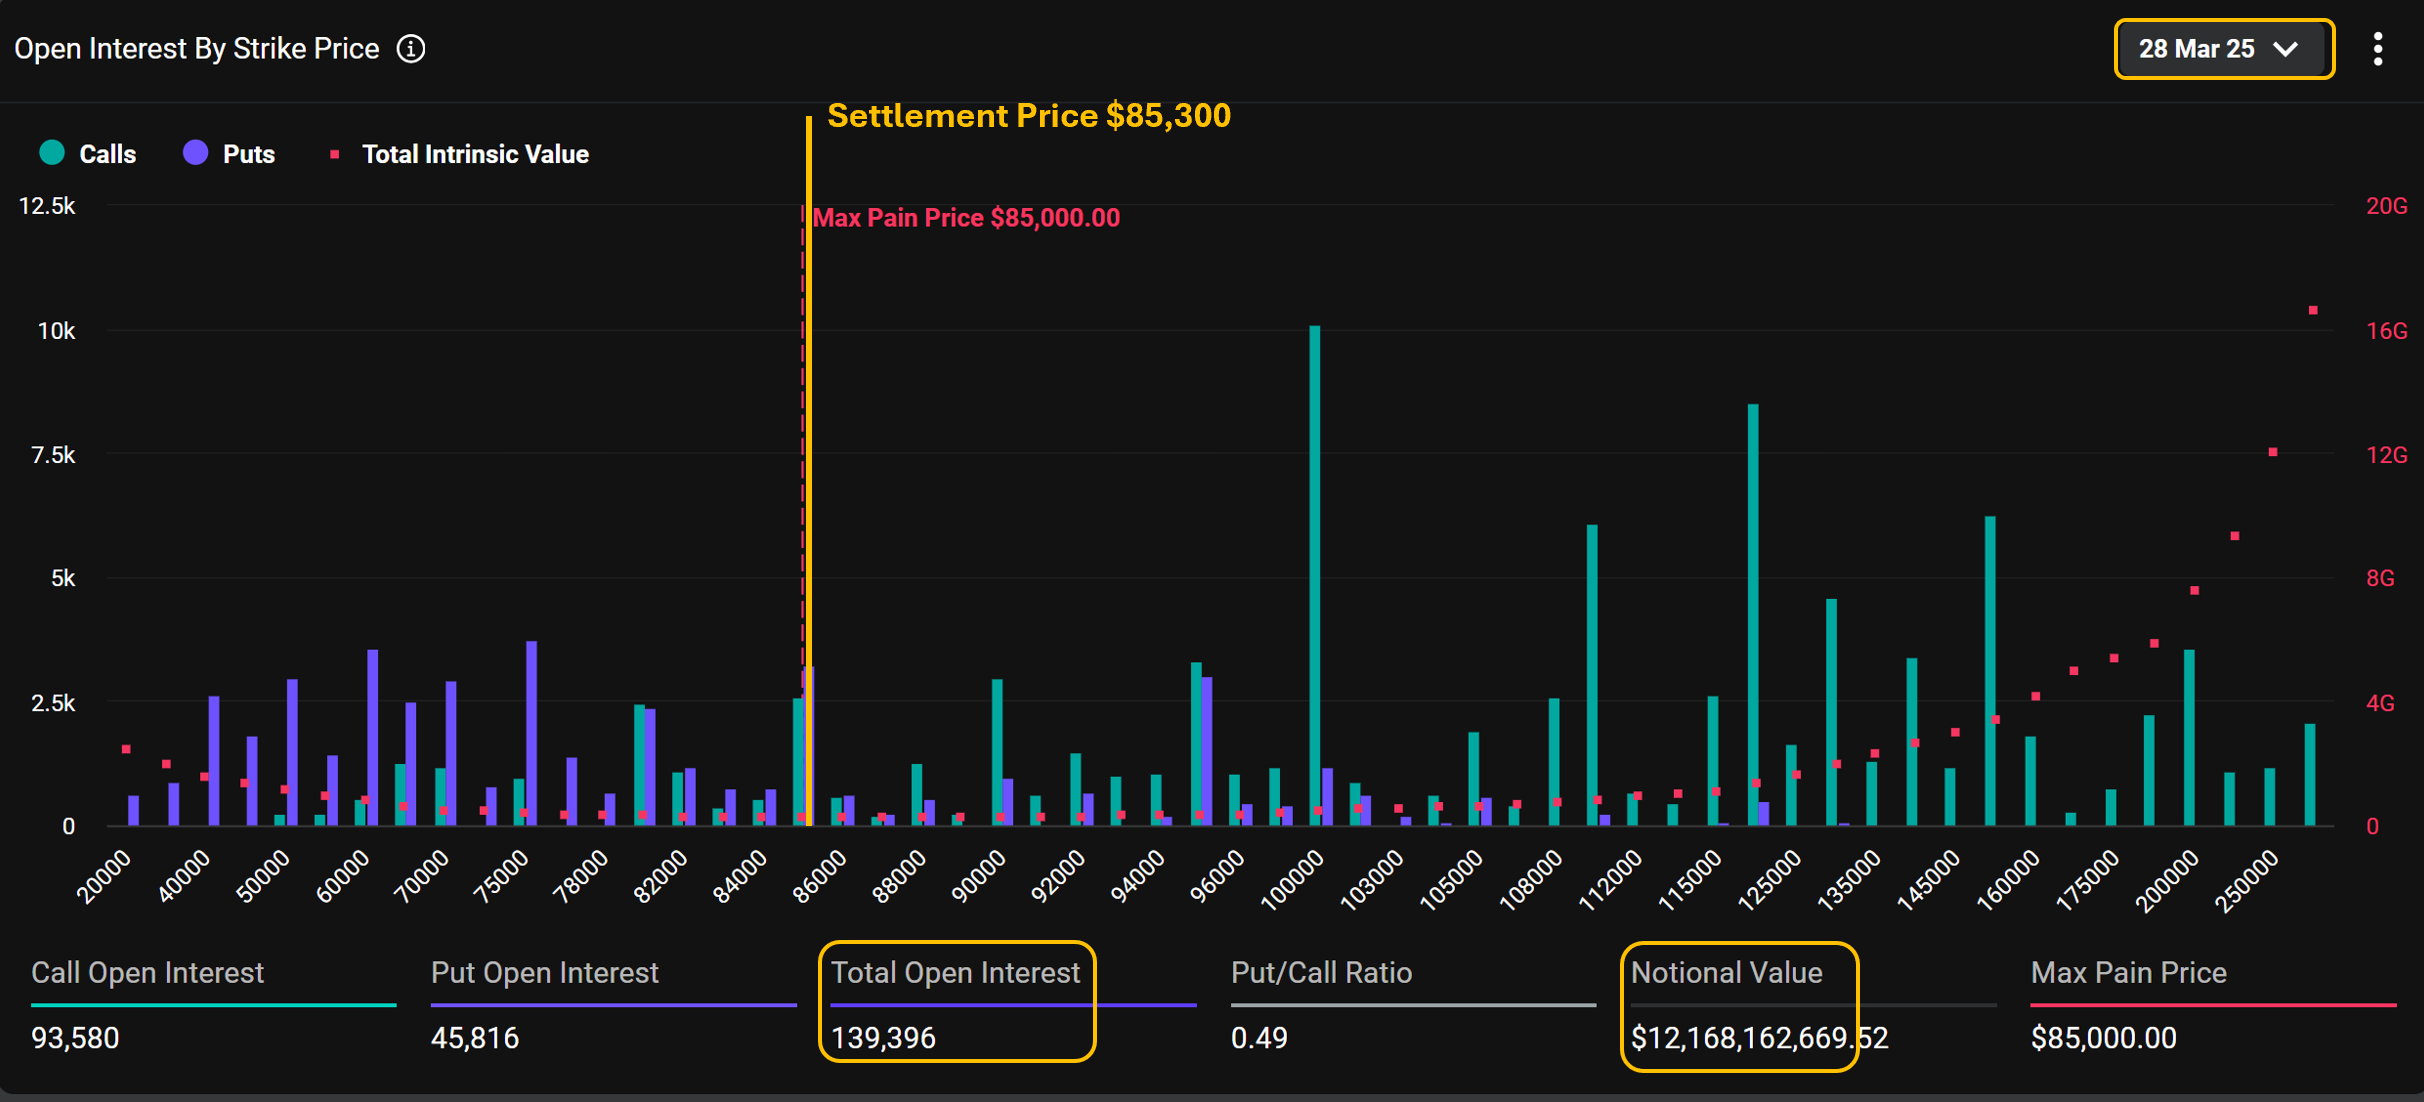
The March 28 expiry closed with approximately 140,000 open contracts and a notional value exceeding $12 billion, making it one of the most significant settlements in recent months. Remarkably, the expiry settled at $85,300—just close the max pain level of $85,000—leaving most of the option contracts out of the money. This includes a large number of optimistic call options at $100K, $110K, and $120K strikes, which had accumulated over the past year as traders anticipated new all-time highs for Bitcoin. In the end, the expiry favored option sellers, many of whom collected premiums on contracts that expired worthless.
Shift to Safety: $80K Strike Leads the Pack
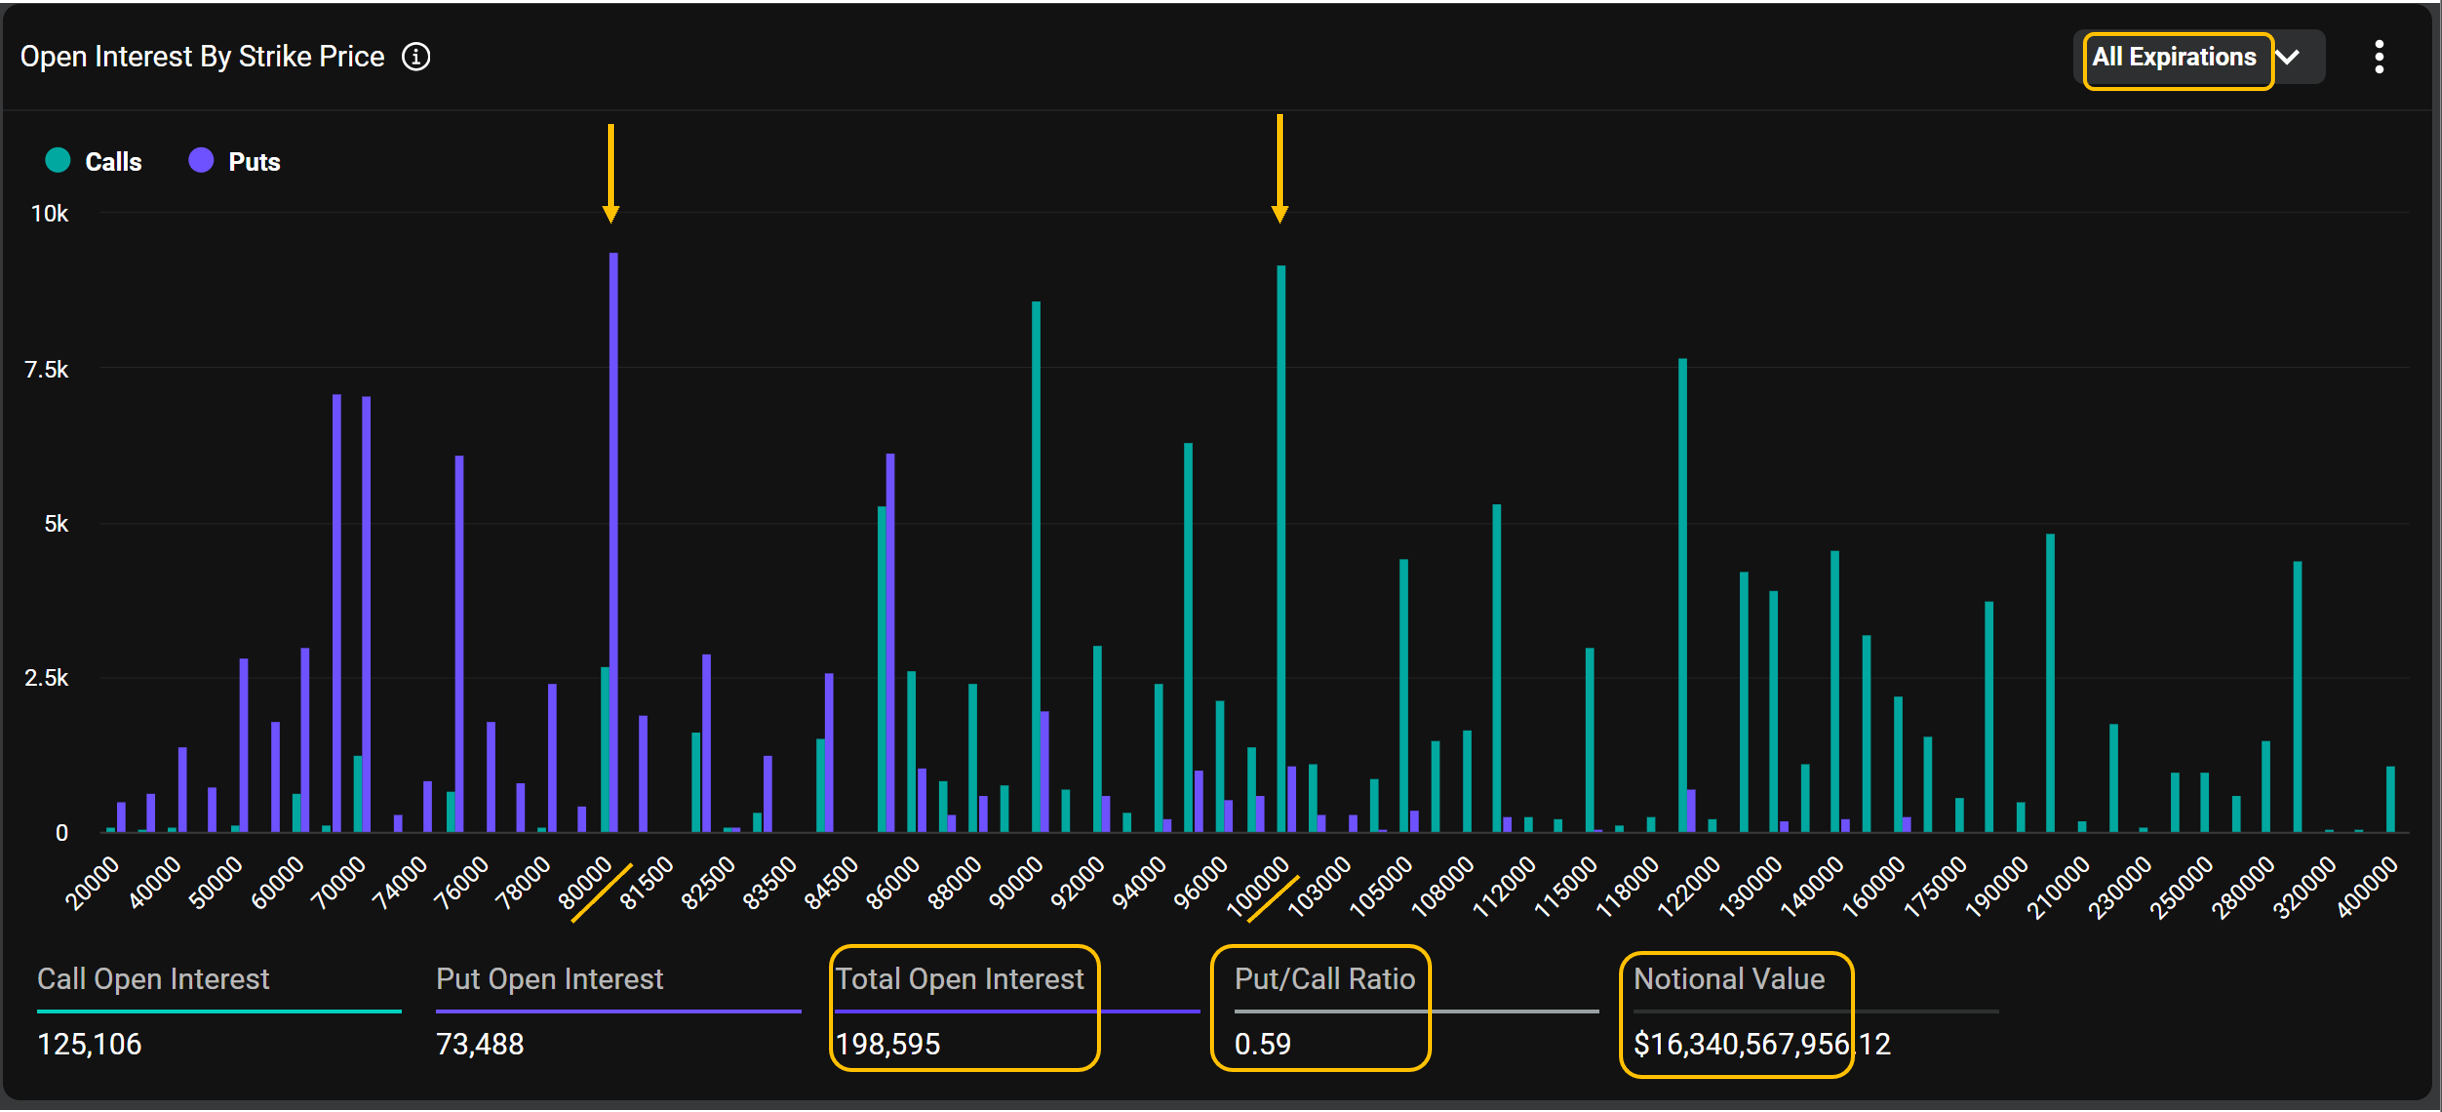
Following the expiration of the March 28 contracts, total open interest across all expiries on Deribit stands at nearly 200,000 contracts—only about 1.5 times larger than that single expiry alone. However, the composition of these positions has shifted noticeably. The put-call ratio has climbed to 0.59, reflecting a more defensive stance among traders. Notably, the $80,000 strike put now holds the highest open interest across all strike prices, suggesting increased demand for downside protection. On the call side, strikes at $90,000, $100,000, and $120,000 stand out.
Next Friday’s Expiry Bears a Defensive Tone
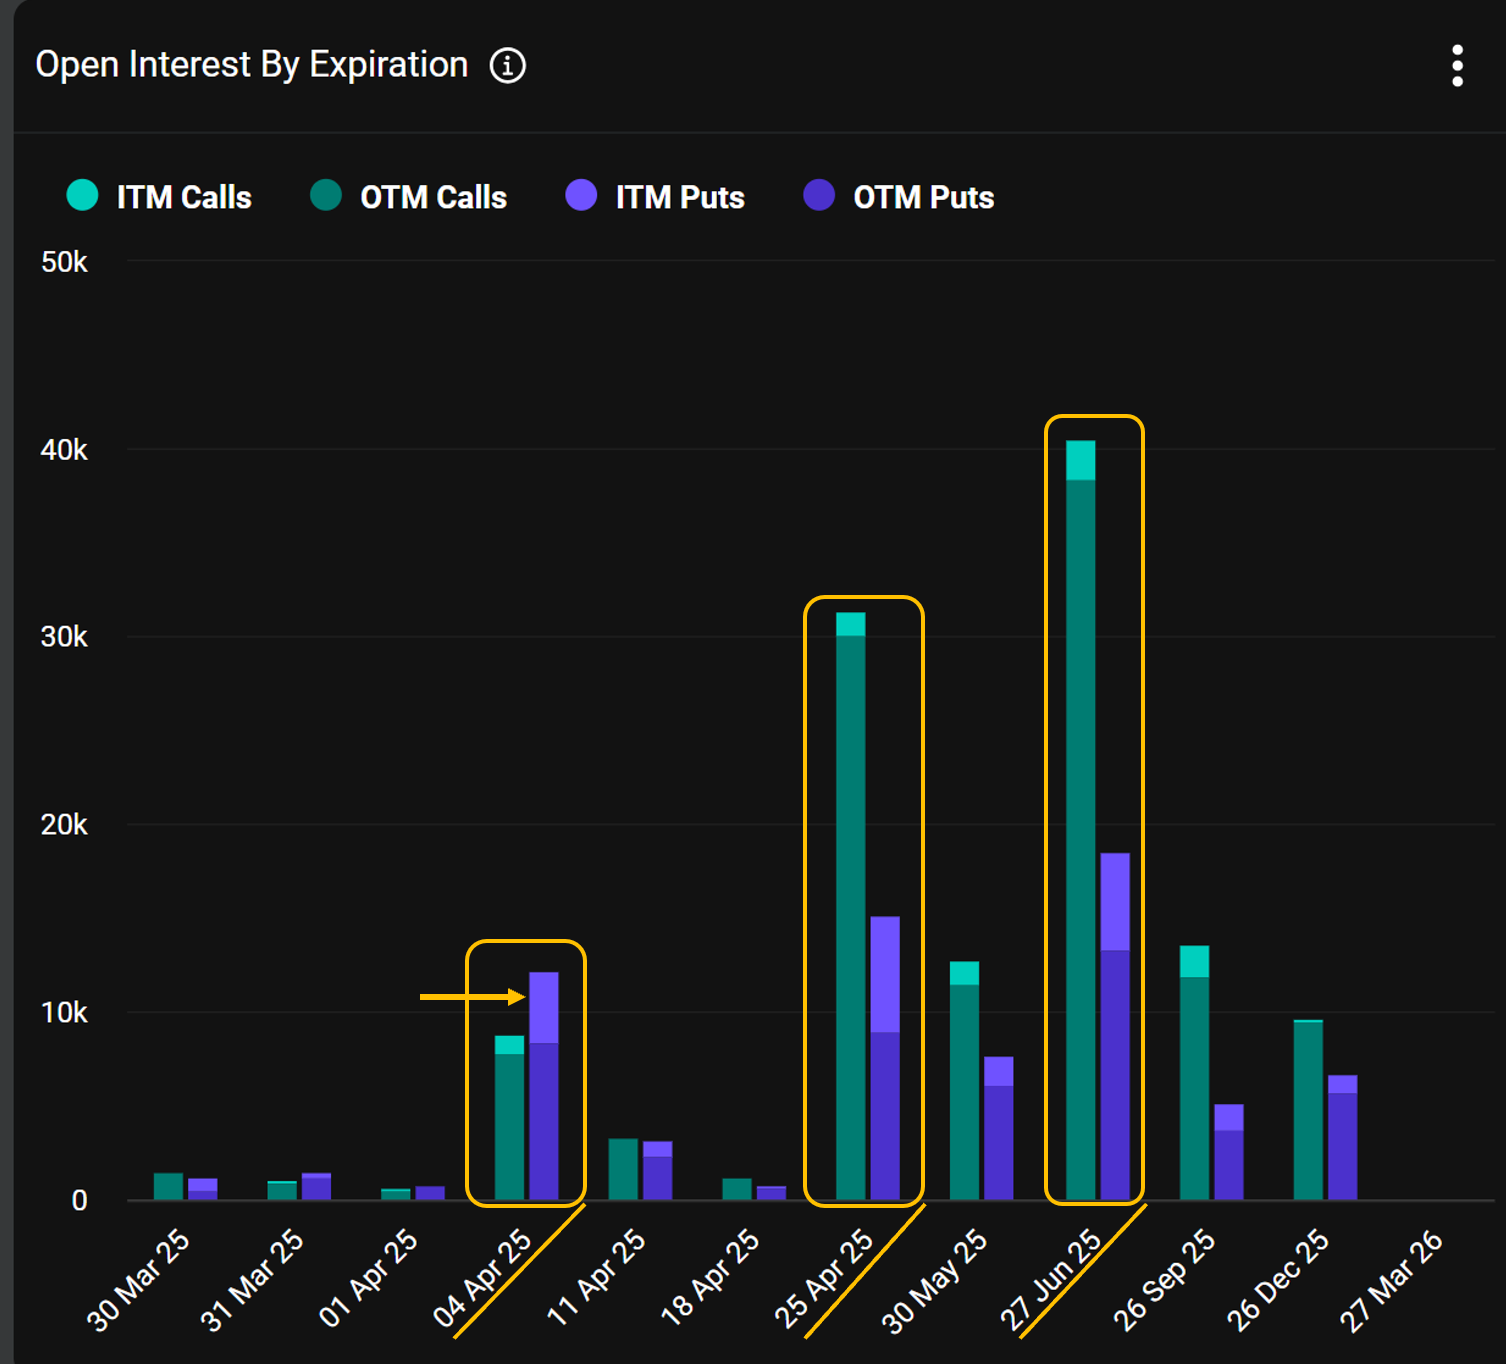
Looking at open interest by expiration on Deribit, we notice an interesting pattern. While June 27 and April 25 lead in total open interest, the short-term expiry on April 4 (Next Friday) draws attention for another reason: its put-call ratio is above 1. This is something we don’t typically see in the Bitcoin options market. The elevated put positioning may reflect growing short-term caution, with traders hedging downside risk ahead of the weekend.
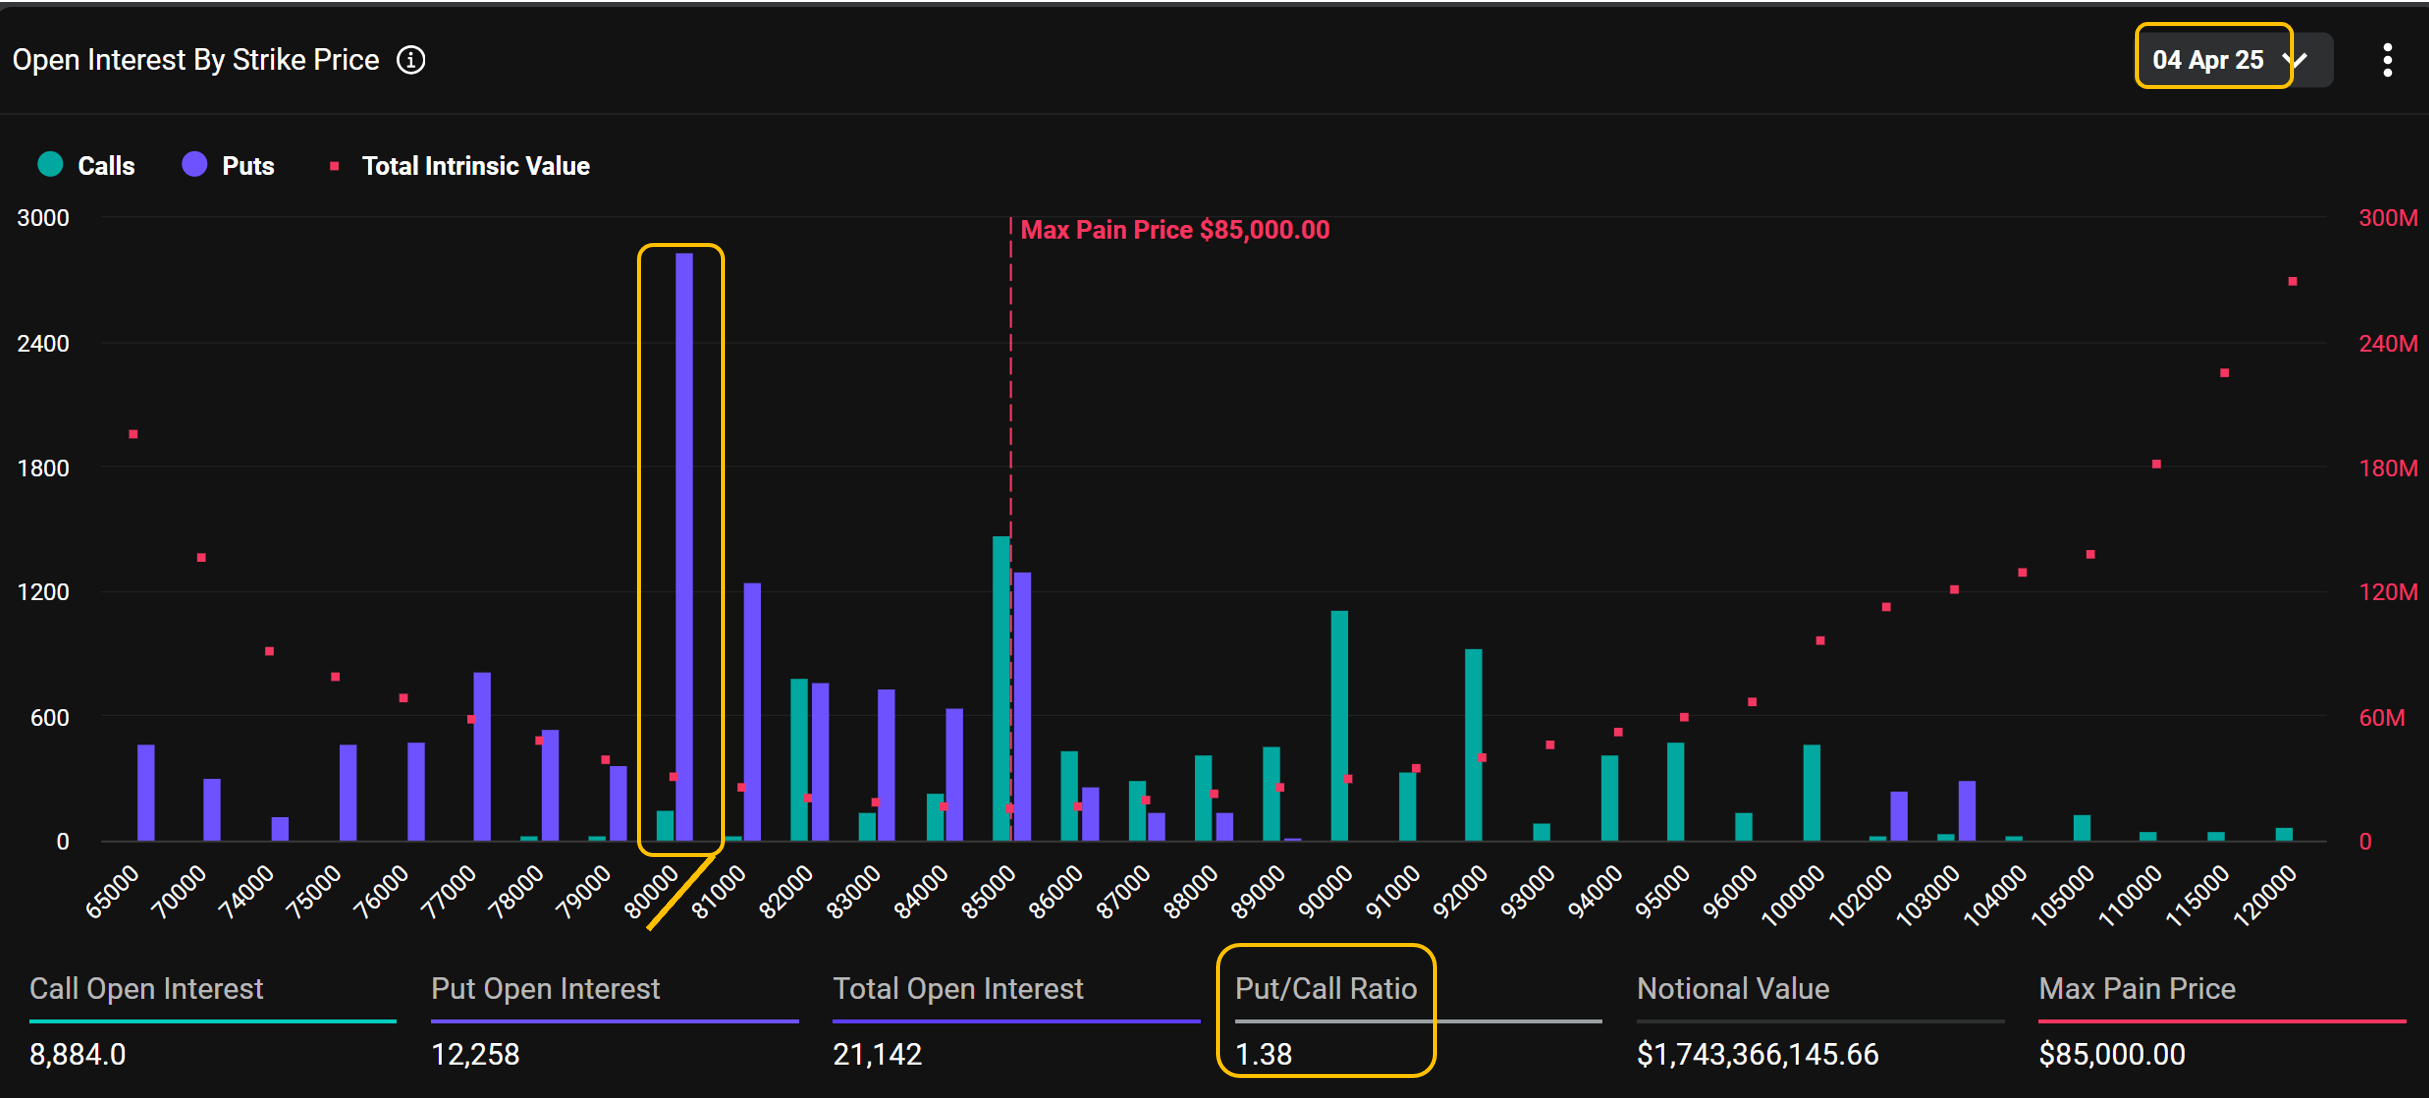
The $80,000 strike Put dominates open interest.
Drilling into the 4 April expiry reveals a notable concentration of open interest around the Put with $80,000 strike. With nearly 3,000 open contracts at this level, this strike clearly dominates the landscape for the week.
Calm Waters Beyond the Near Term
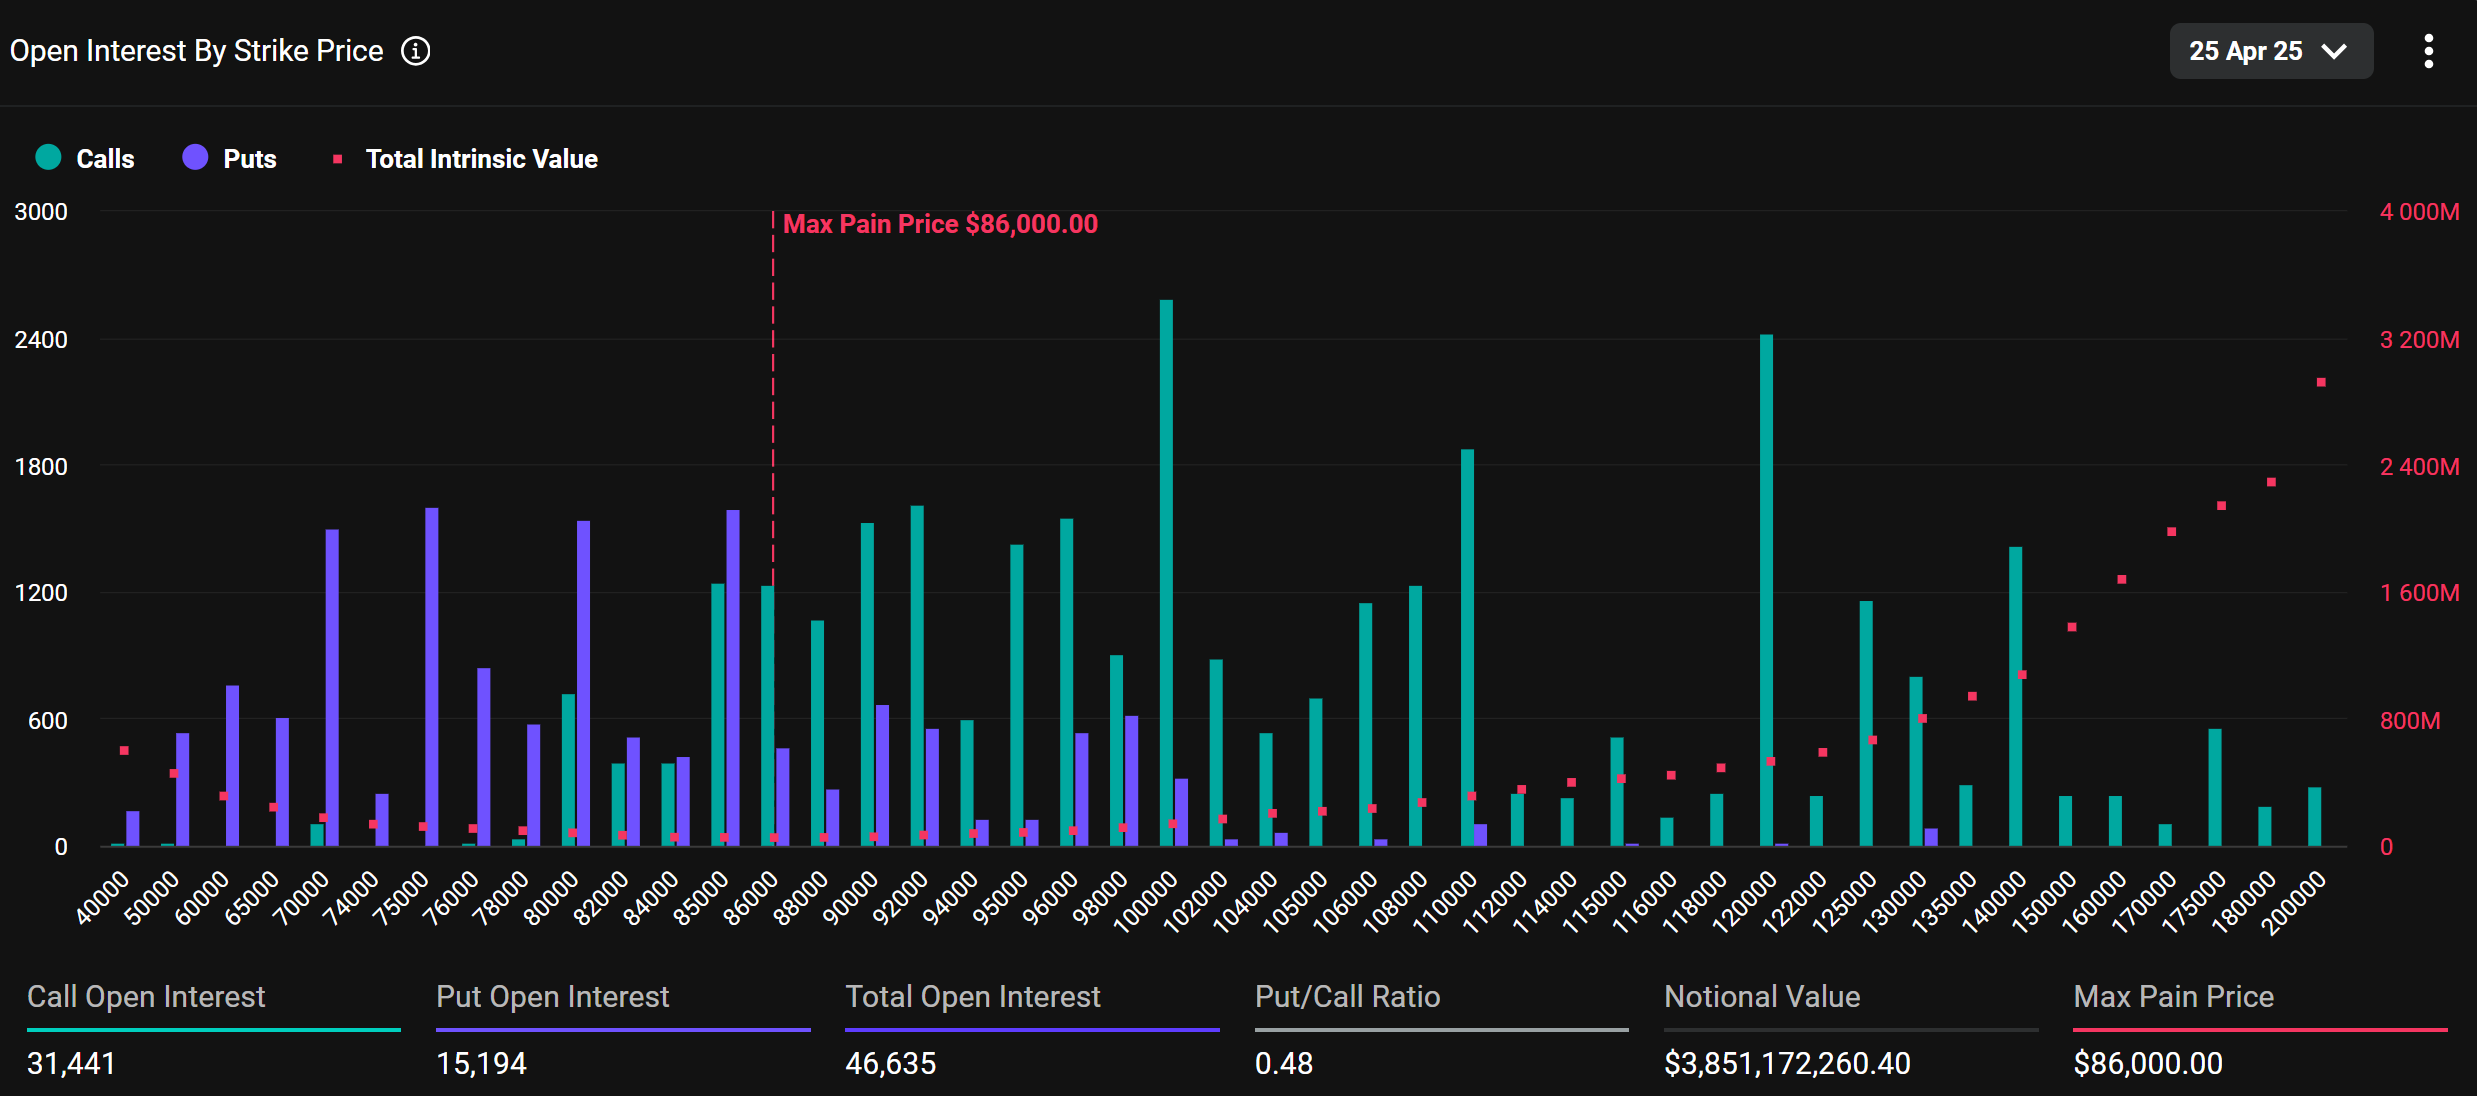
For the 25 April expiry, positioning appears relatively typical. The put/call ratio stands at 0.48, consistent with the broader trend of call dominance in Bitcoin options. Most of the open interest lies in out-of-the-money (OTM) call options, with some scattered OTM puts holding smaller sizes.
Price Down, Volatility Up
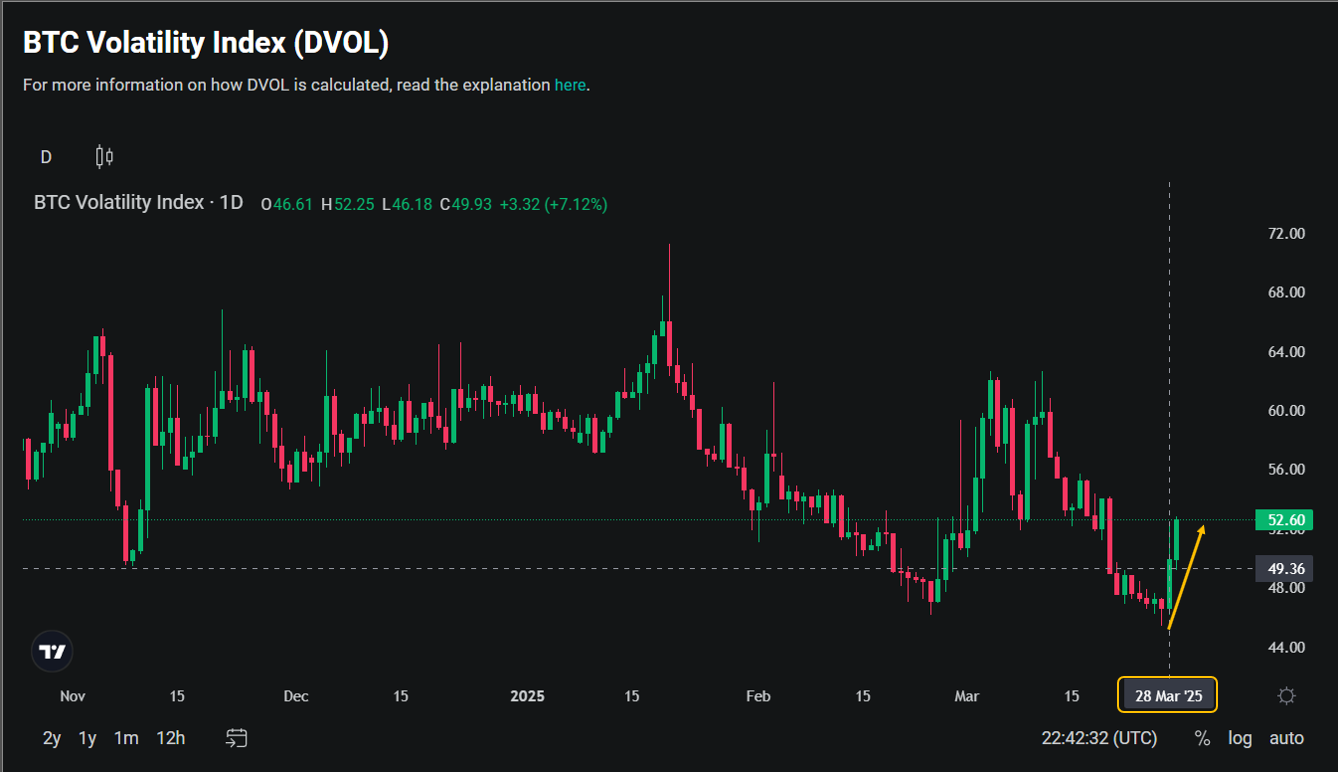
Interestingly, right on March 28—when Bitcoin’s price dropped below $85,000—we saw a sharp uptick in implied volatility, as illustrated in the DVOL chart. This inverse correlation between price and volatility indicates that the market is becoming more sensitive to downside moves. The rise in IV suggests heightened concern among traders, as they increasingly seek protection against further declines. Such behavior is typical in uncertain environments, where falling prices amplify demand for puts and drive up volatility levels.
Skew Signals Defensive Shift
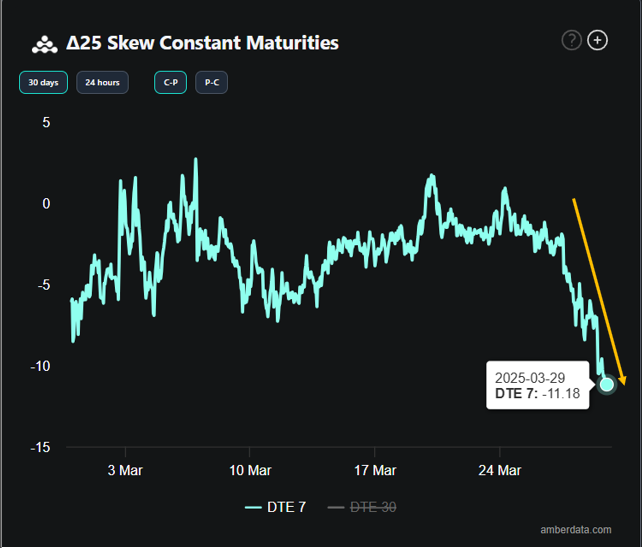
Another clear indicator of market sentiment lies in the skew between implied volatilities of call and put options with the same delta and days to expiry. The chart above shows that, as of March 29, the 7-day delta-25 skew has dropped to -11.18. This means that the implied volatility of put options is over 11 points higher than that of equivalent call options—a strong signal that traders are heavily pricing in downside protection. In short, puts have become significantly more expensive than their call counterparts, reflecting a clear tilt toward fear and hedging in the current market.
Recent Activities
Heatmap Highlights $80K Hedge
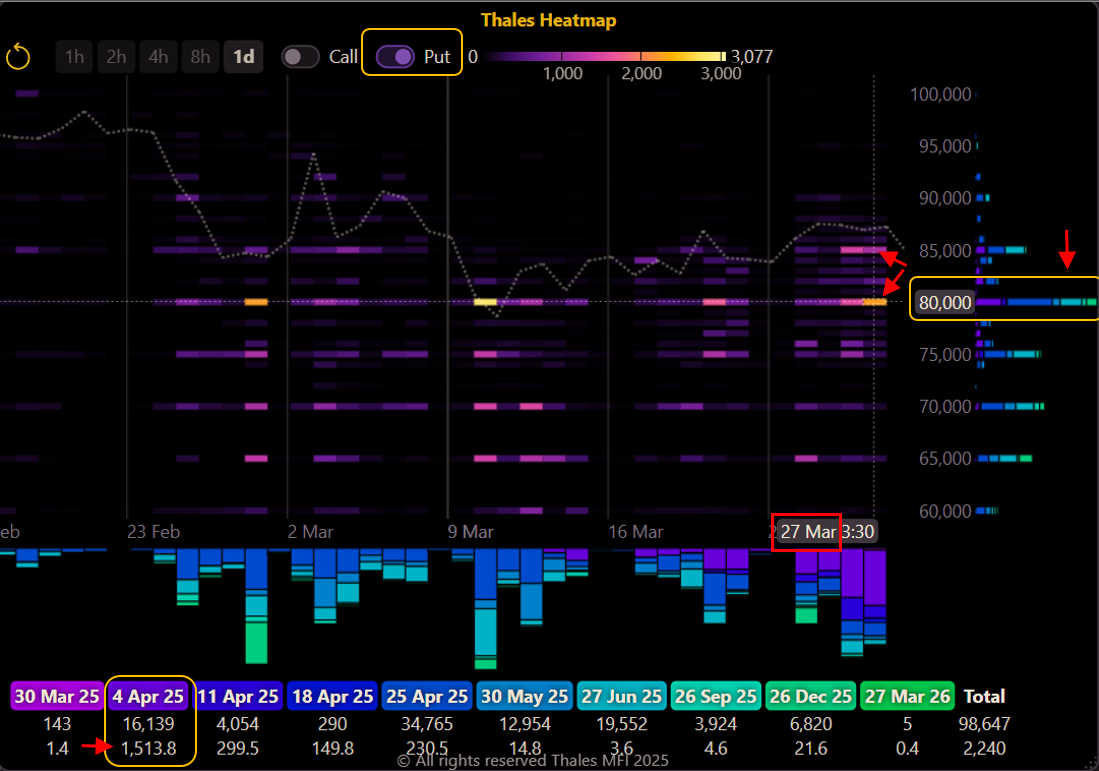
To track recent trading activity, we turn to the Thales Heatmap. Filtering for put options, the chart reveals a strong spike in trades on March 27—just one day before the major March 28 expiry. Most notably, over 1,500 contracts were traded at the $80,000 strike for the April 4 expiry, standing out as a concentrated bet or hedge. Additionally, a significant cluster of trades is visible at the $85,000 strike, showing increased demand for downside protection around these key levels.
Call Buyers Give It Time
(OSS)
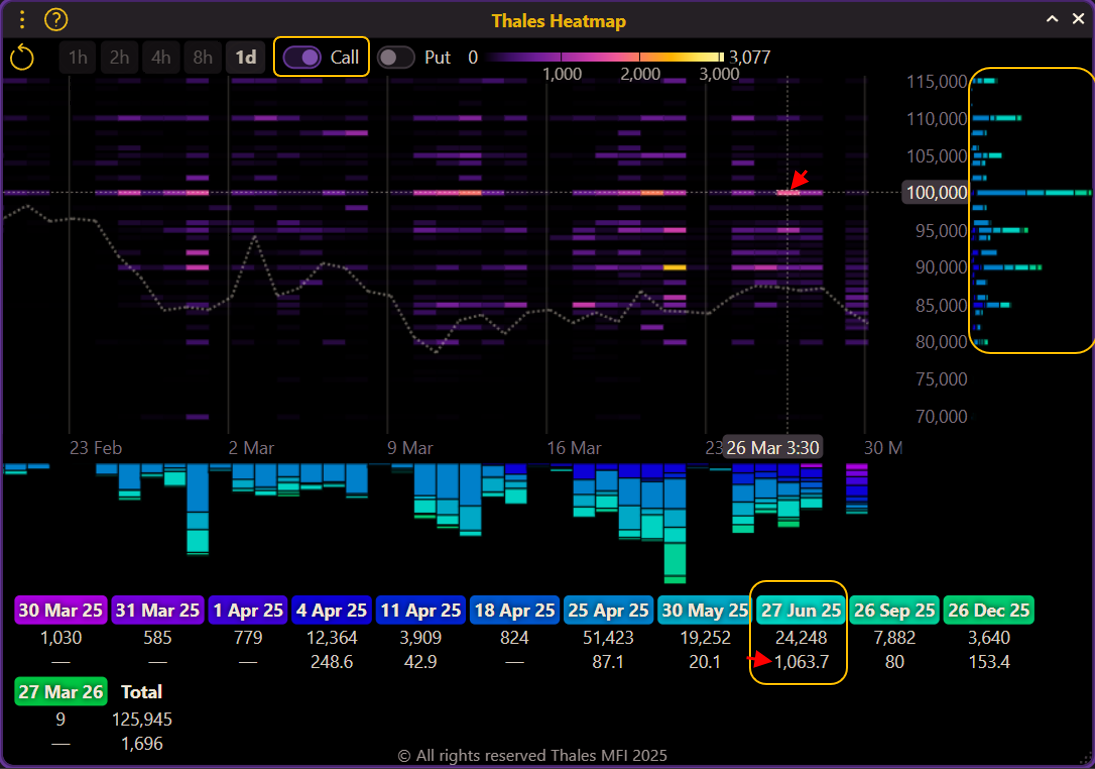
On the call side, the heatmap shows a clear preference for longer-dated expirations. This is visible in the color tones on the right—shades of light blue to green—signaling higher DTE (days to expiry) contracts. A notable example is the 100,000 strike call, which saw over 1,000 contracts traded on March 26 for the June 27 expiry. This pattern suggests that traders seeking upside exposure are allowing more time for the market to reach those elevated levels, in contrast to the near-term fear visible on the put side.
Defensive Bias in Latest Buyer Flows
(OSS)
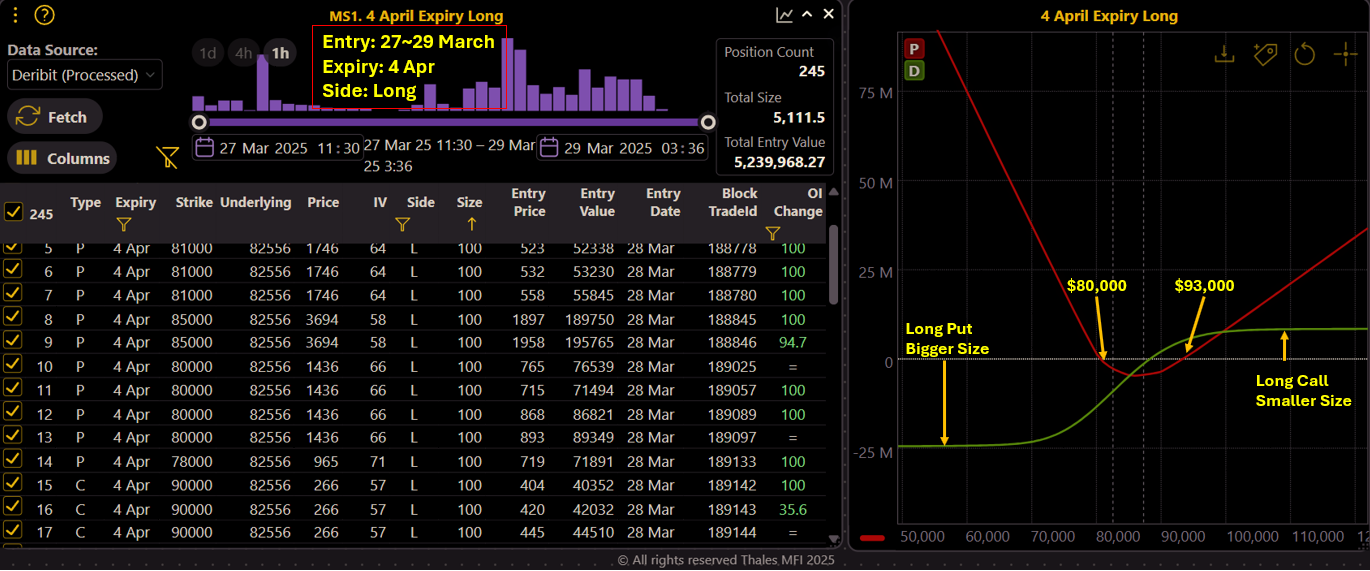
To analyze the most recent short-term Bitcoin options activity, the Market Screener was used with filters set to highlight trades entered between March 27 and 29, expiring on April 4, and limited to long positions—those taken by option buyers. The aggregate PnL graph reveals a structure similar to a long strangle, but with a pronounced emphasis on the put side.
The delta curve (green line) indicates that the put options (around the $80,000 strike) were purchased in significantly larger volume than the corresponding calls. This asymmetry reflects a clear preference for downside protection, reinforcing the conservative stance traders have adopted in the near term. Alongside the signals from the heatmap and skew, this dataset offers another layer of evidence pointing toward heightened concern over potential price declines.
Strategy Spotlight
(OSS)
While aggregate data gives us a bird’s-eye view of market sentiment, sometimes zooming into a single large block trade can reveal even sharper insights. In this section, we track significant options strategies recently executed by large players—strategies that may hint at unique perspectives or well-calculated positioning.
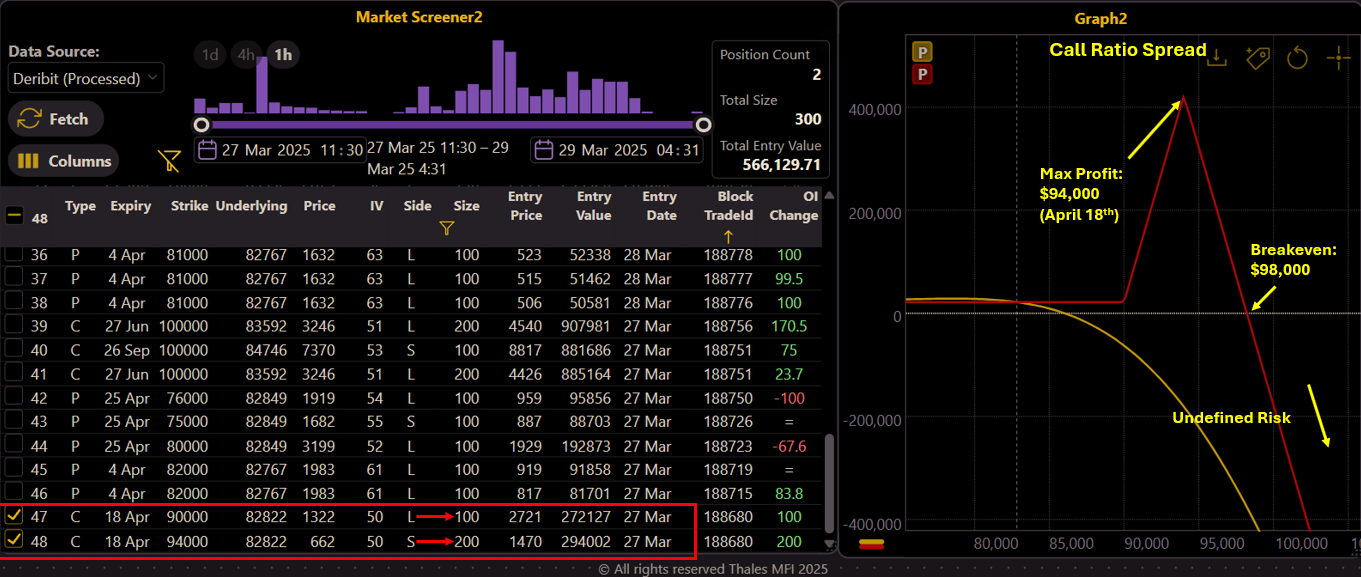
This week, a notable trade popped up in the Market Screener when filtering for entries made within the last 48 hours. The selected strategy is a Call Ratio Spread on the April 18 expiry, consisting of:
- Long 100x BTC Calls @ $90,000
- Short 200x BTC Calls @ $94,000
The payoff structure, displayed on the right, peaks if Bitcoin settles right at $94,000 by expiry. The position has a breakeven at $98,000, and beyond that, enters into a zone of unlimited theoretical loss.
The setup suggests the trader is positioned for a moderate upside, expecting price action to lean toward $94K without breaching $98K. It reflects a measured optimism—one that’s bullish but grounded in the view that extreme moves beyond $98K are unlikely.
Of course, markets are dynamic, and positions like this reflect a thesis, not a certainty. This strategy may or may not play out as intended, but it provides a fascinating window into how some traders shape their risk-reward views in real time.
Bottom Line
The passing of the March 28 expiry marked more than just the end of a major options cycle—it signaled a shift in sentiment. With volatility climbing, skew deepening, and downside hedges intensifying, the mood in the Bitcoin options market has clearly turned more cautious. Yet not all bets are bearish. While some traders are aggressively protecting against declines, others are quietly positioning for a tempered rise—if and when momentum returns.
This week’s data reflects a market in transition: not panicked, but alert. Traders are managing exposure more carefully, leaning into puts for near-term safety while still leaving room for upside further down the road. Whether you’re adjusting strategies or observing from the sidelines, these evolving flows offer a valuable lens into what the market fears—and what it still hopes for.
Disclaimer
This report is for informational purposes only and does not constitute financial advice, trading recommendations, or an offer to buy or sell any financial instrument. Options trading involves significant risk and is not suitable for all investors. Always conduct your own research and consult with a qualified advisor before making investment decisions.