Introduction
As Bitcoin hovers above key support levels in an increasingly uncertain macro landscape, the options market is sending a clear message: traders are preparing for turbulence. This week’s Outlook dives deep into that sentiment shift, analyzing how recent expiries, rising implied volatility, and notable trading patterns across different maturities all point toward a heightened demand for downside protection.
From the defensive positioning around the April 4 expiry to the persistent preference for puts in upcoming maturities, the tone across the board is cautious. We explore how the Put/Call ratio has steadily risen, how traders are clustering around protective strikes like $70K and $80K, and how even sophisticated block trades—like a sizable Bear Diagonal Spread—mirror the broader mood. Whether you’re trading short-term volatility or simply watching for early signs of the next big move, this Outlook unpacks the subtle and not-so-subtle clues shaping today’s Bitcoin options market.
Explore these market dynamics firsthand with the Thales Options Strategy Simulator (OSS)
Market Snapshot
Expiry Recap: Defensive Stance Prevails into 4 April
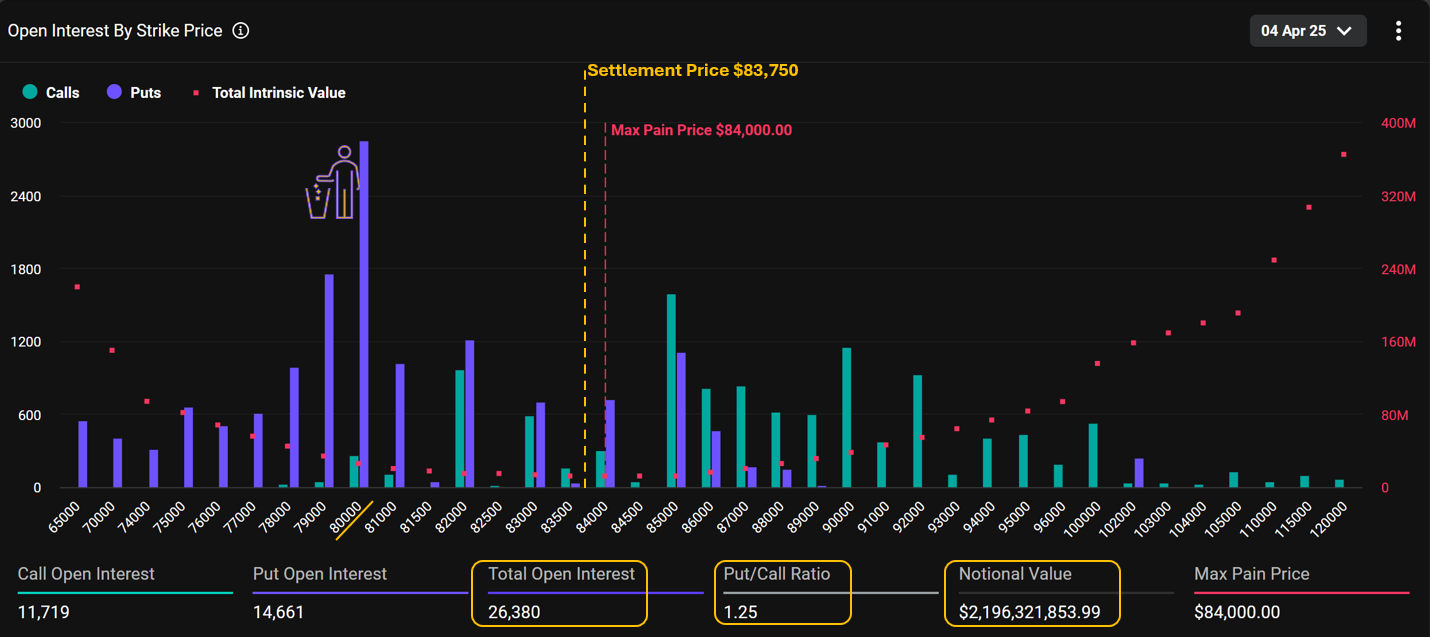
The April 4 expiry contracts settled at $83,750 on Friday, just a touch below the max pain price of $84,000. This close alignment meant that most options expired worthless — including a notable cluster of puts at the $80,000 strike, which held the largest open interest.
More than 26,000 contracts were open for this expiry, carrying a notional value of nearly $2.2 billion. The Put/Call ratio stood at 1.25, reflecting a short-term defensive posture among traders. This elevated skew toward puts suggests market participants were increasingly concerned about downside risks, likely influenced by broader macro uncertainty — particularly the ongoing tariff war.
This cautious sentiment wasn’t isolated to crypto markets; traditional assets also declined over the week. Still, Bitcoin managed to stay above $80,000 into expiry — a level many feared could break. Even so, a longer-term shift is unfolding: the overall Put/Call ratio in the BTC options market has climbed from ~0.5 to 0.65, signaling growing demand for downside protection.
Next Friday
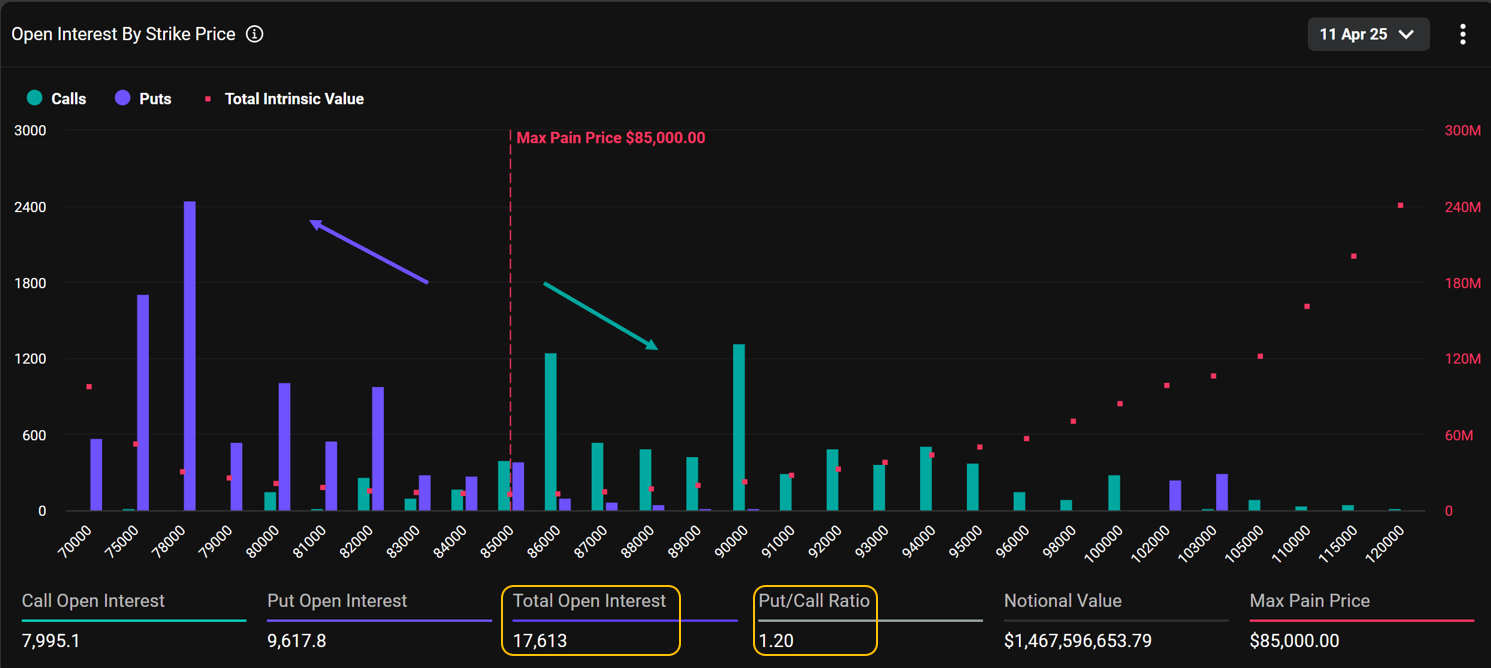
Despite the fact that most put contracts expired worthless last Friday, put options continue to dominate the short-term sentiment heading into the April 11 expiry. As of this report, the expiry holds over 17,000 open contracts, with a Put/Call ratio of 1.20, underscoring ongoing caution among traders.
This persistent preference for puts—despite their recent ineffectiveness—suggests that the shadow of macroeconomic uncertainty still looms large. Broader market fears, including concerns about inflation, interest rates, and global trade tensions, continue to weigh on sentiment, particularly in crypto and Bitcoin markets.
Macro Fear Surfaces Across Expiries in the Bitcoin Options Market
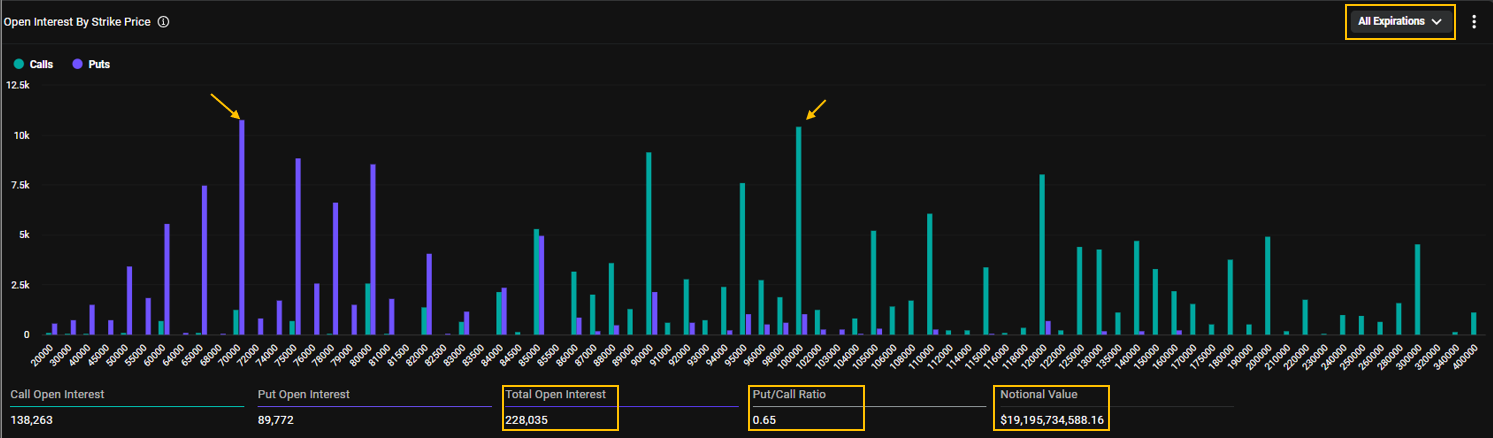
Looking at the broader Bitcoin options landscape across all expirations, a notable shift has occurred: put options are gaining a larger share of the market. Over the past 20 days, the Put/Call ratio has climbed from 0.52 to 0.65, reflecting a growing appetite for downside protection.
One particularly revealing data point is the put option at the $70,000 strike, which now stands as the single largest open interest across the entire options board (see chart above from Deribit). This concentration isn't just noise—it highlights how traders, especially those with spot exposure, are increasingly turning to puts as a hedge.
Volatility Awakens
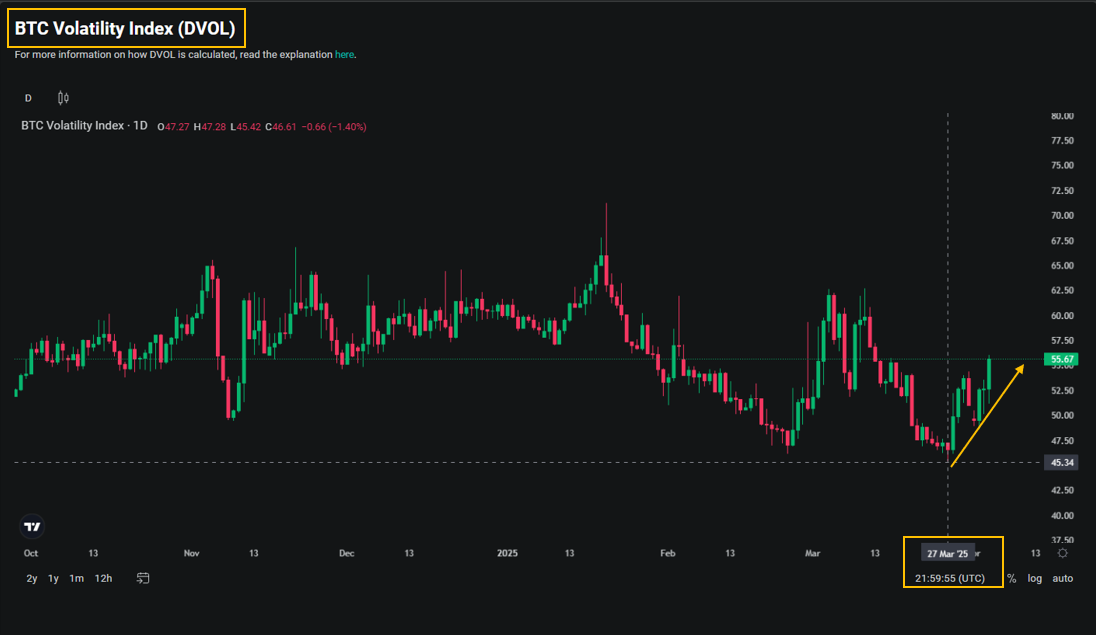
This rise in fear has also been reflected in the implied volatility (IV) of Bitcoin options. The Deribit Volatility Index (DVOL), has surged to 56%, up sharply from its recent low of 45%—the lowest reading of the year.
This spike follows a period of calm, marked by a tight-range market that emerged after Bitcoin's post-ATH correction and the brief bullish sentiment surrounding Trump's re-election narrative. As that honeymoon faded, uncertainty took hold again.
The uptick in IV signals growing tension and heightened expectations of price swings in Bitcoin. While the direction of the next major move remains unclear, volatility is back—often a precursor to significant market shifts.
Recent Activities
Thales Heatmap
(OSS)
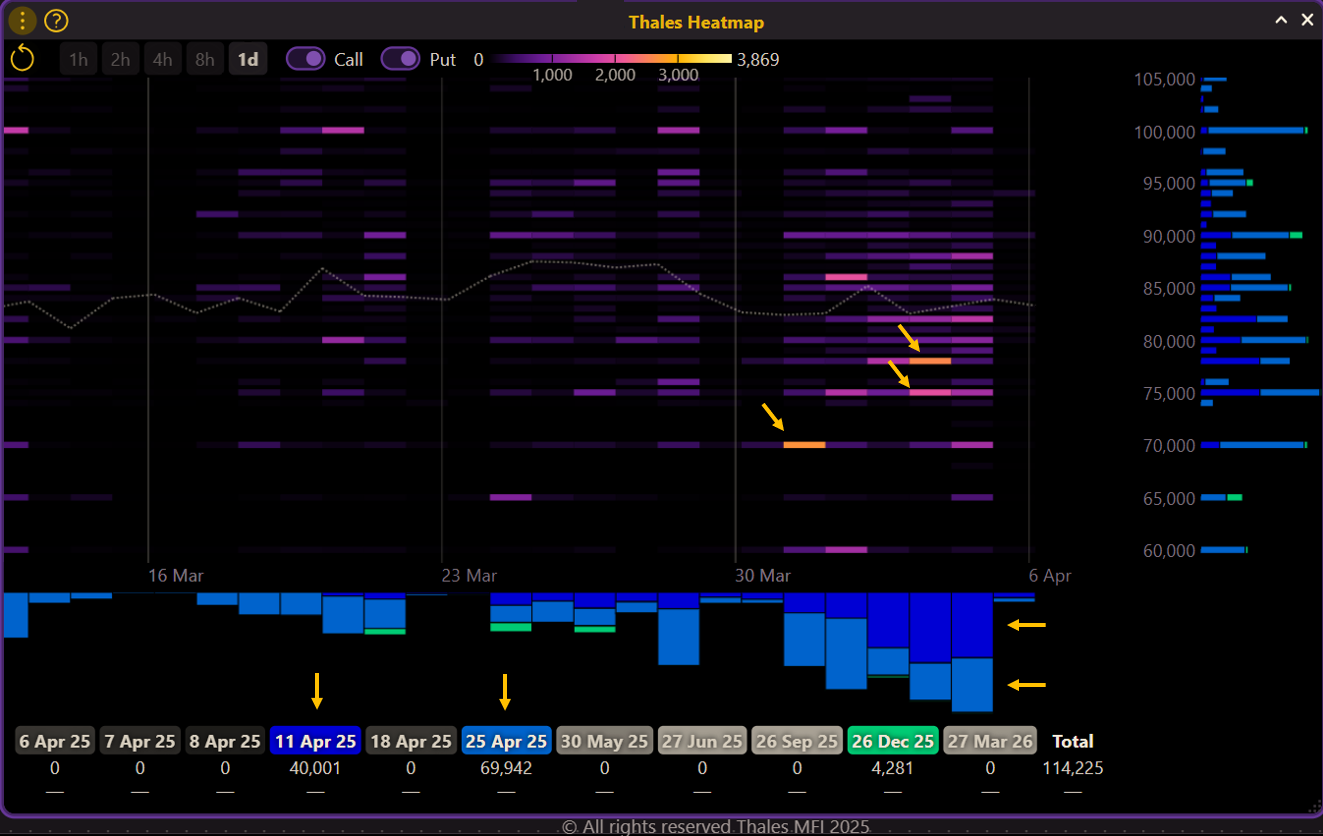
The Thales Heatmap offers a visual representation of where trading activity is concentrated across different strike prices and expiries. In this view, we’ve filtered for three key maturities—April 11, April 25, and December 26—to observe sentiment across short-, mid-, and long-term horizons.
The intensity of color shows the volume of options traded, with warmer tones (yellow/orange) highlighting the most actively traded contracts. The dotted line traces Bitcoin’s index price, giving context to strike levels relative to spot.
From early April onward, trading has intensified below the spot price, with a clear focus on put options at $80,000 and lower. This trend is especially strong in near-term maturities (April 11 and 25), reinforcing the broader market's cautious stance.
Thales Market Screener
(OSS)
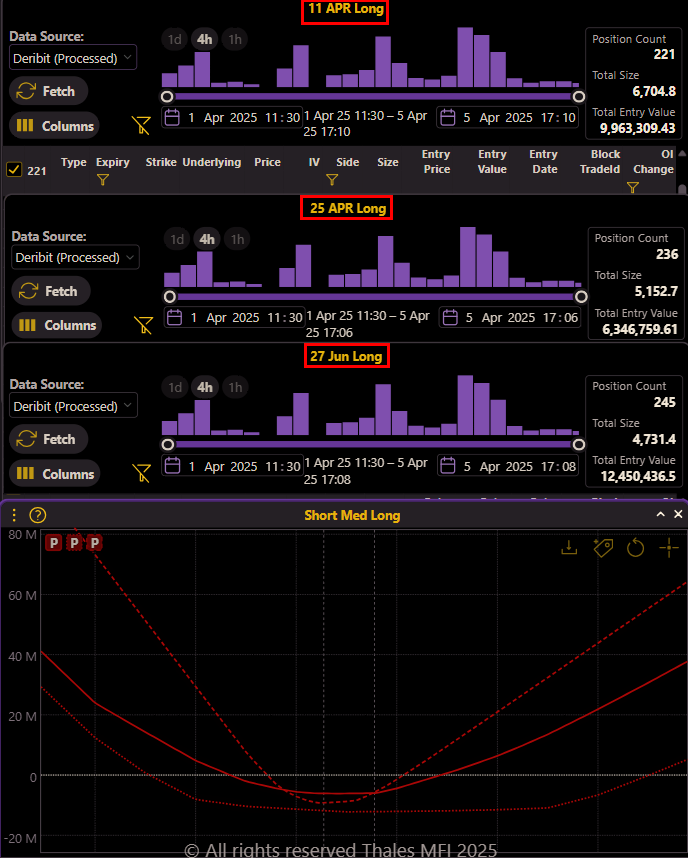
To better understand the recent behavior of options traders, we used the Thales Market Screener to analyze long-side strategies initiated between April 1st and 5th. We filtered for three key expirations — April 11, April 25, and June 27 — representing short-, medium-, and long-term horizons.
By comparing the profit-and-loss (PnL) and delta curves of each Market Screener result, an interesting pattern emerges:
(OSS)
All three strategies resemble long strangles, where both puts and calls are purchased. Yet, the structure varies with the expiration:
- The short-term (April 11) positions feature strikes much closer to the current price, forming a tighter strangle.
- The longer-dated (April 25 & June 27) positions are wider, reflecting more room for movement or uncertainty over time.
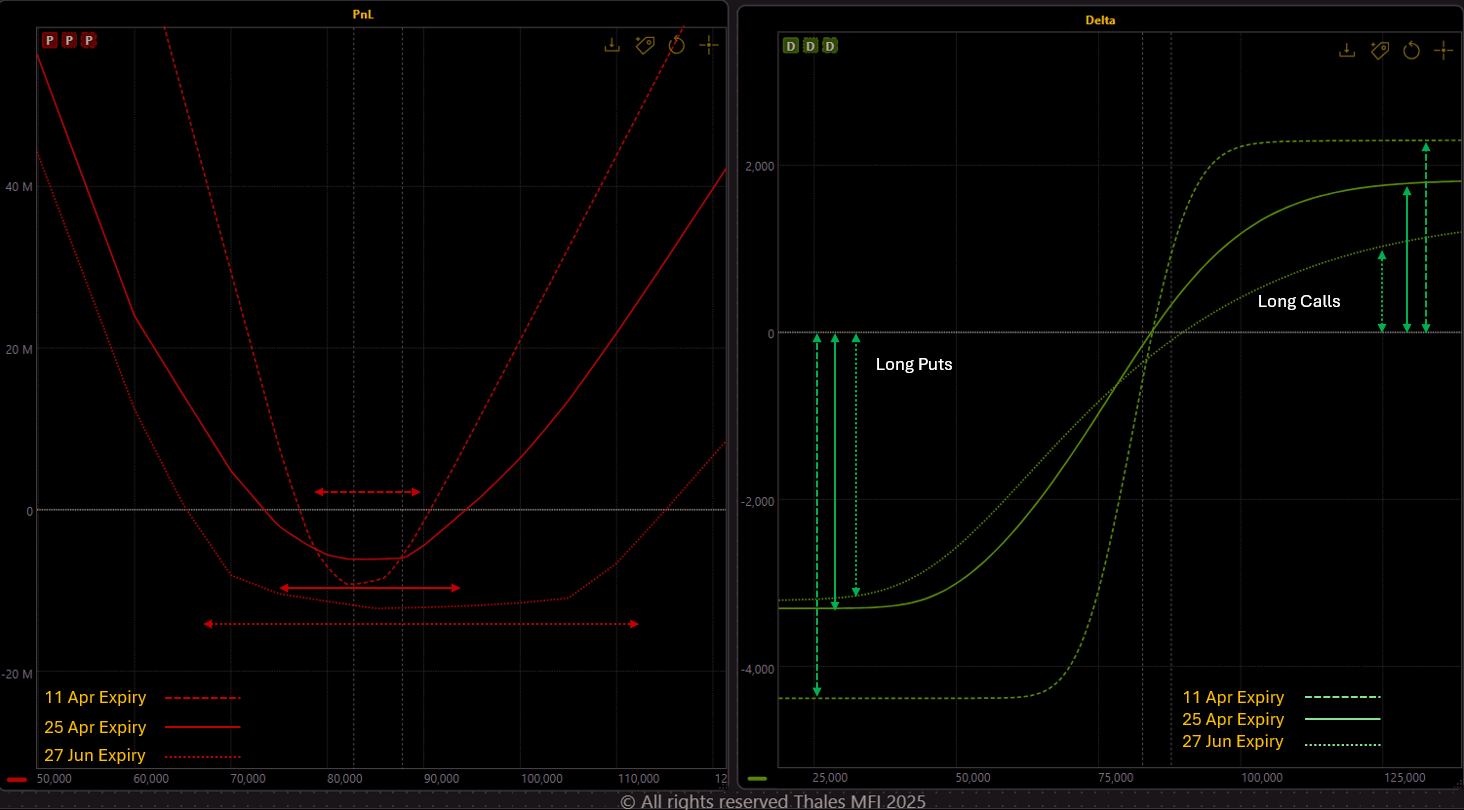
A closer look at the delta curves reveals two key takeaways:
- Put options carry nearly double the delta exposure compared to calls across all three maturities — a clear indication that traders are leaning toward downside protection.
- The total size of positions is significantly skewed toward shorter-dated strategies, particularly the April 11 expiry. This suggests that traders are prioritizing near-term volatility, likely anticipating that any major price movement — especially to the downside — will unfold in the coming days rather than months.
In summary, the options market currently reflects a cautious stance, with a defensive bias toward puts and a short-term focus on volatility. Even traders placing longer-dated bets are hedging their exposure more than speculating on a major rally — a sentiment aligned with ongoing macroeconomic uncertainties.
Strategy Spotlight
(OSS)
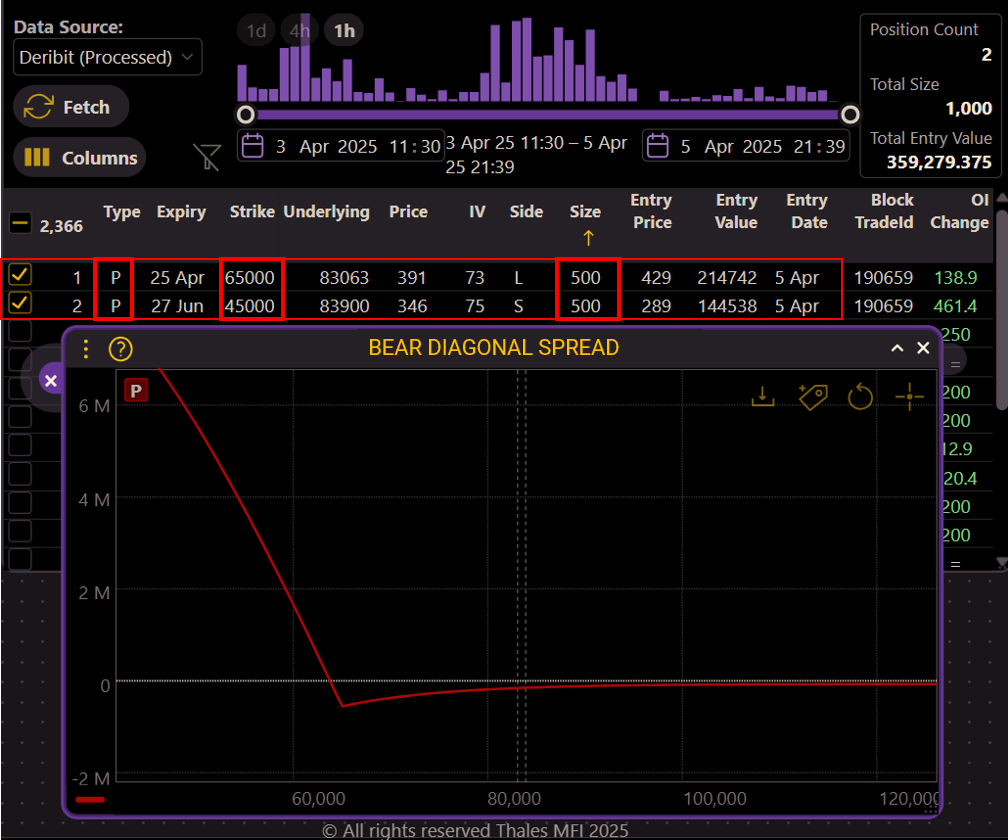
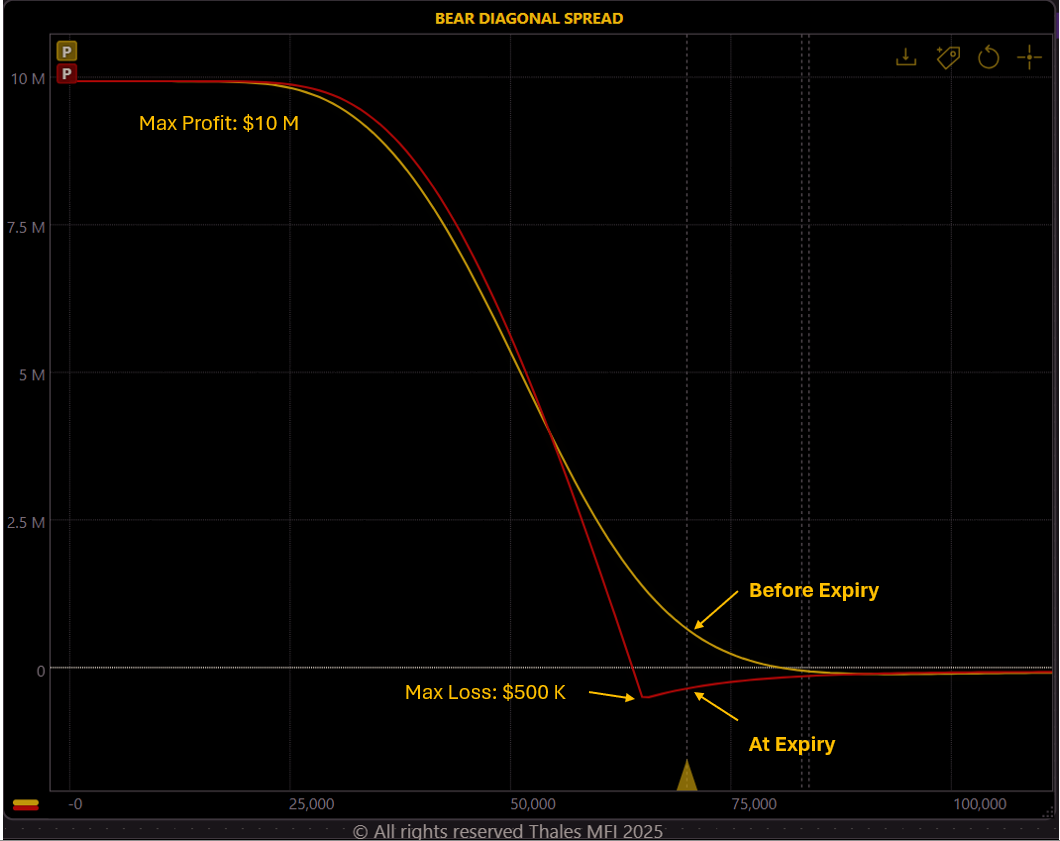
One of the most notable block trades observed in the Market Screener Recently was a Bear Diagonal Put Spread, built with considerable size and clear intent.
The structure consists of:
- Long 500x BTC Puts at $65,000 strike, expiring 25 April,
- Short 500x BTC Puts at the $45,000, expiring 27 June.
This is a debit spread with a modest initial outlay of around $70,000, carrying a maximum loss of ~$500,000. However, if Bitcoin's price drops below the $64,000 breakeven, the strategy enters profit territory.
(OSS)
Importantly, this trade does not require holding to expiry. As shown in the yellow curve, the position can become profitable well before expiration, offering flexibility in management.
Given its low risk, high reward potential, and bearish structure, this diagonal put spread aligns well with the broader market sentiment identified in this outlook: elevated demand for downside protection, rising implied volatility, and cautious positioning among large players.
Bottom Line
The data tells a coherent story: Bitcoin options traders are positioning defensively, with puts dominating across short-, mid-, and even long-term expiries. The Put/Call ratio is climbing, implied volatility is waking up, and directional bets remain cautious. While spot prices have held key levels—for now—the growing emphasis on downside hedging suggests that market participants are bracing for renewed volatility. Whether it’s the macro uncertainty, looming rate concerns, or technical fragility, the appetite for protection is clear. In this environment, staying aware of how sentiment is evolving in the options market can offer valuable foresight amid the noise.
Disclaimer
This report is for informational and educational purposes only and does not constitute financial advice or a recommendation to buy or sell any financial instruments. All market views expressed are based on publicly available data and are subject to change without notice. Please conduct your own research or consult with a qualified financial advisor before making any trading decisions.