Introduction
After weeks of hesitation, the Bitcoin options market has begun to stir with fresh energy. While last week’s expiry settled neatly at max pain, favoring sellers once again, subtle shifts in volatility and positioning suggest that sentiment may be evolving. The bounce off the $75K zone wasn’t just a price move—it was mirrored by a rare alignment between rising implied volatility and rising price, hinting that the market may now be pricing in upside with greater conviction.
This week’s Outlook explores that shift in depth. From a notable rebound in skew to renewed interest in bullish call structures, the data points to traders cautiously opening the door to a resumed bull run. Yet caution still lingers—especially in near-term positioning—underscoring the market’s delicate balance between optimism and defense.
We break down the April 11 expiry, examine the current stance for the April 18 expiry, analyze evolving skew patterns, and dive into how traders are structuring exposure through tools like Thales’ Heatmap and Market Screener. A standout bull call spread also earns the spotlight this week, capturing the market’s cautiously constructive tone.
Explore these market dynamics firsthand with the Thales Options Strategy Simulator (OSS)
Market Snapshot
April 11 Expiry Recap
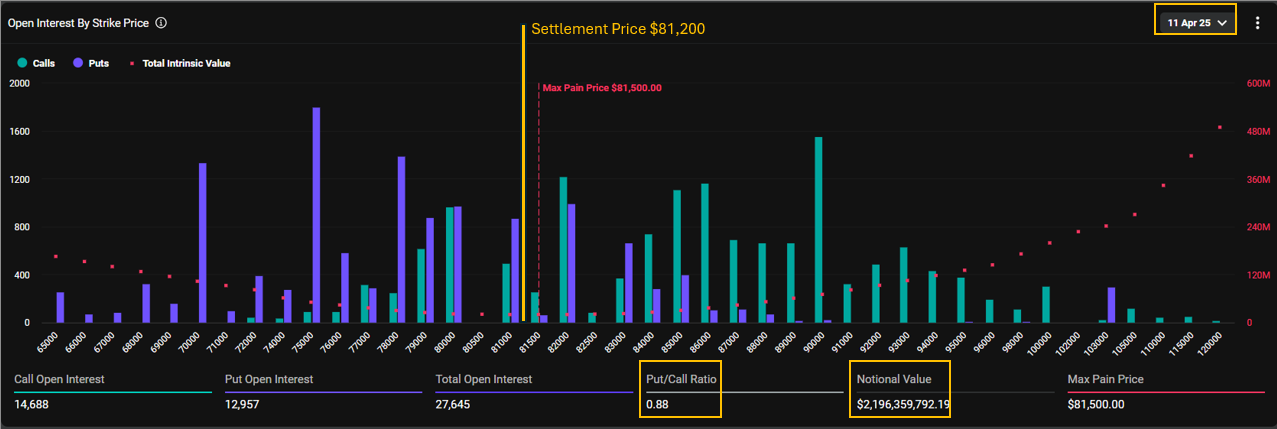
Put/Call ratio at 1.20 with over 17K contracts open—traders remained defensive despite prior week’s expiry.
After dipping below $75K on April 7 and 9—amid escalating tension from Trump’s tariff war—Bitcoin rebounded sharply just before Friday’s expiry, settling at $81,200, almost perfectly aligned with the $81,500 max pain level.
This mirrors the cautious positioning seen earlier in the week, when traders favored puts (Put/Call ratio: 1.20 at the time), anticipating downside. In the end, however, the expiry once again favored sellers, with most contracts expiring worthless.
Bigger Picture
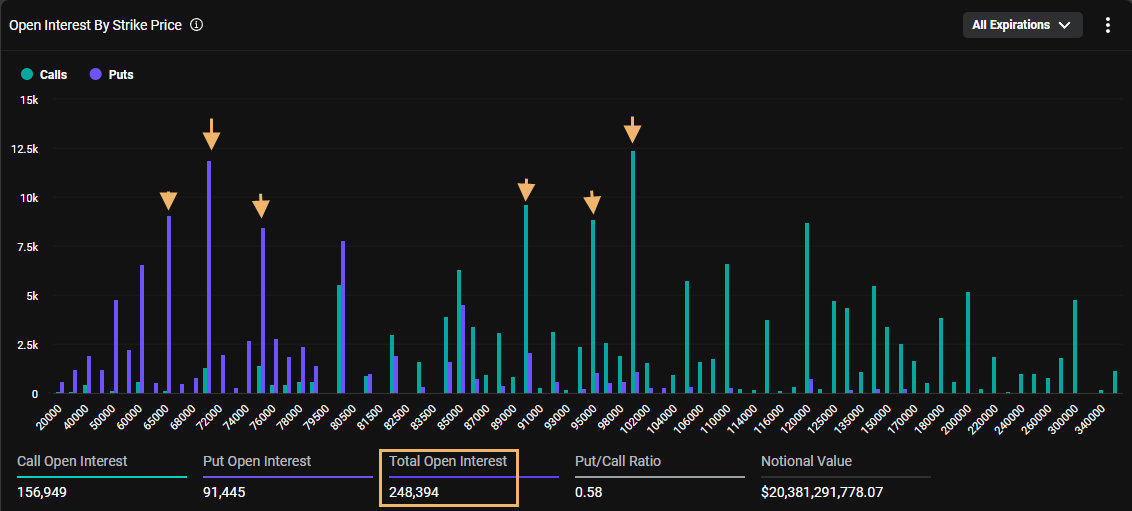
Total OI at ~248K; downside focus at $65K–$75K, upside shifts lower to $90K–$100K as macro fear sets in.
As of now, the Bitcoin options market on Deribit holds nearly 250,000 open contracts, with a total notional value exceeding $20.3B. While open interest remains elevated, the market is leaning slightly conservative—reflected in a Put/Call ratio of 0.58. This tilt suggests that while call options still dominate in volume, traders are not excessively chasing upside.
A closer look at the strikes with the highest open interest reveals where traders believe the battleground lies. On the downside, $65K, $70K, and $75K continue to anchor protective positioning. On the upside, speculative enthusiasm has recalibrated: once clustered around $120K and higher, large call positions have now migrated toward $90K, $95K, and $100K—indicating a more measured expectation for price rallies.
Volatility Shift: IV Now Supporting the Upside?
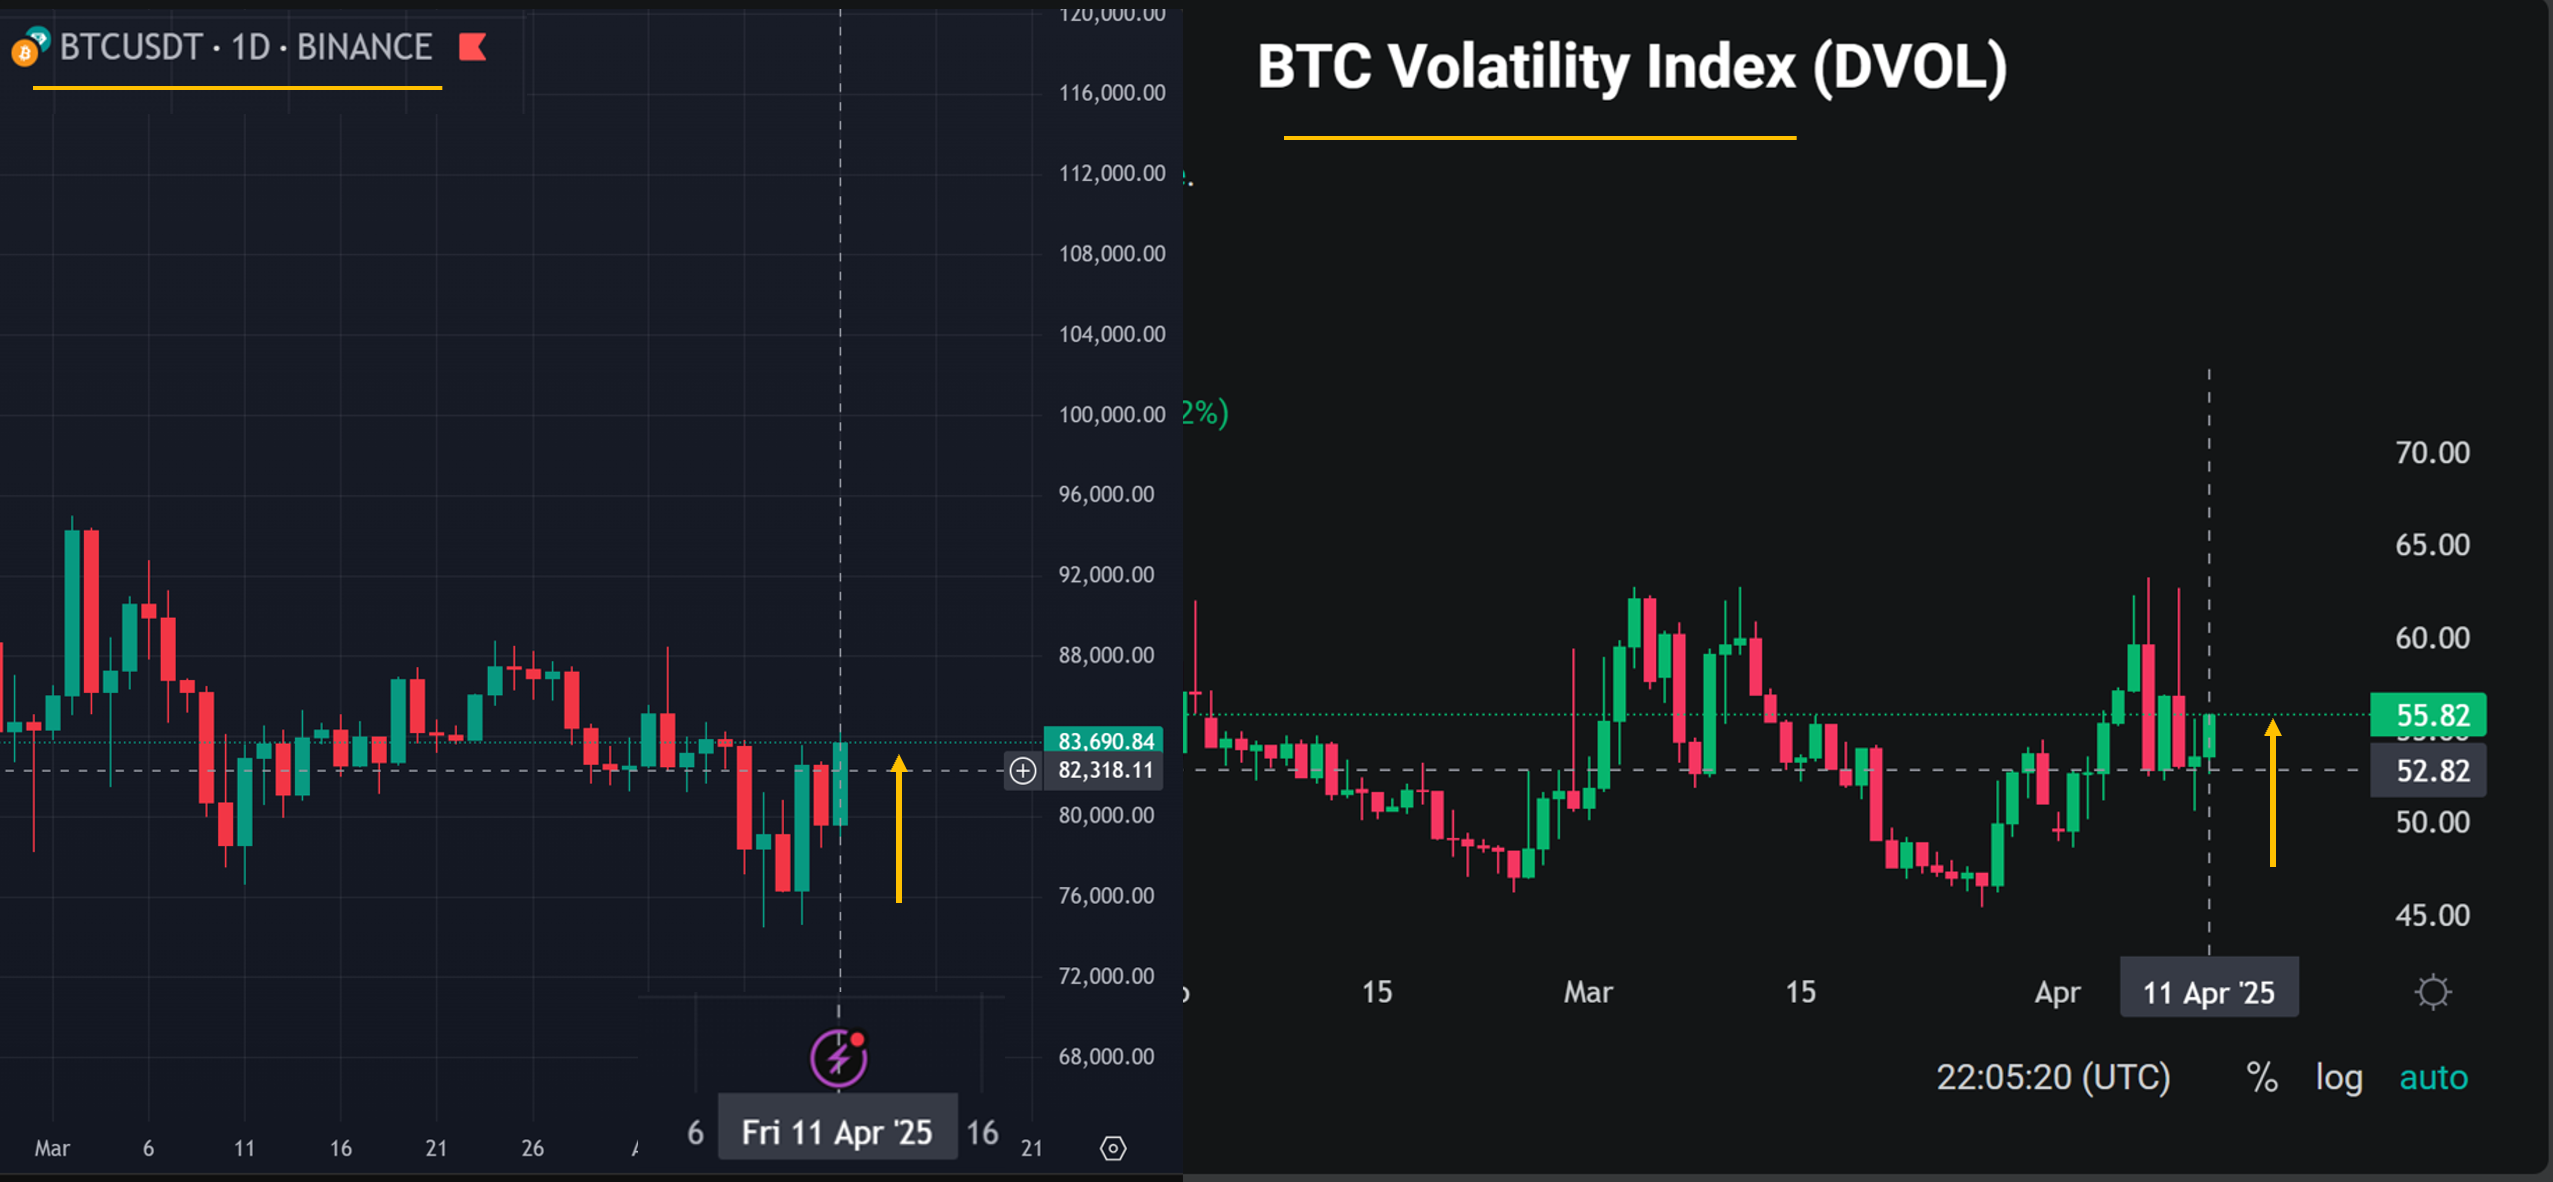
both BTC price and IV moved higher together—suggesting IV may now be confirming upside expectations rather than downside fear.
A subtle but potentially important shift has emerged in the market’s volatility dynamics. In recent weeks, we've consistently observed a negative correlation between BTC price and implied volatility (IV): whenever Bitcoin dropped, IV spiked—signaling fear and confirming downside pressure. This relationship was evident in our previous Outlooks and widely interpreted as the market bracing for further corrections.
But something changed on April 11.
As illustrated in the charts above—BTC/USDT (left, Binance) and DVOL (right, Deribit)—Bitcoin rebounded sharply above $80,000, and IV also rose in tandem. The Deribit Volatility Index (DVOL) climbed back above 55, forming a positive correlation with the underlying price. This alignment suggests that the options market may no longer be purely hedging downside. Instead, traders could be anticipating renewed volatility with upside potential, possibly marking the end of the recent stall in bullish momentum.
While it’s too early to confirm a structural shift, this divergence from the past few weeks hints that sentiment may be turning. If IV continues to rise alongside price, it may signal that the long-awaited bull continuation is back on the table.
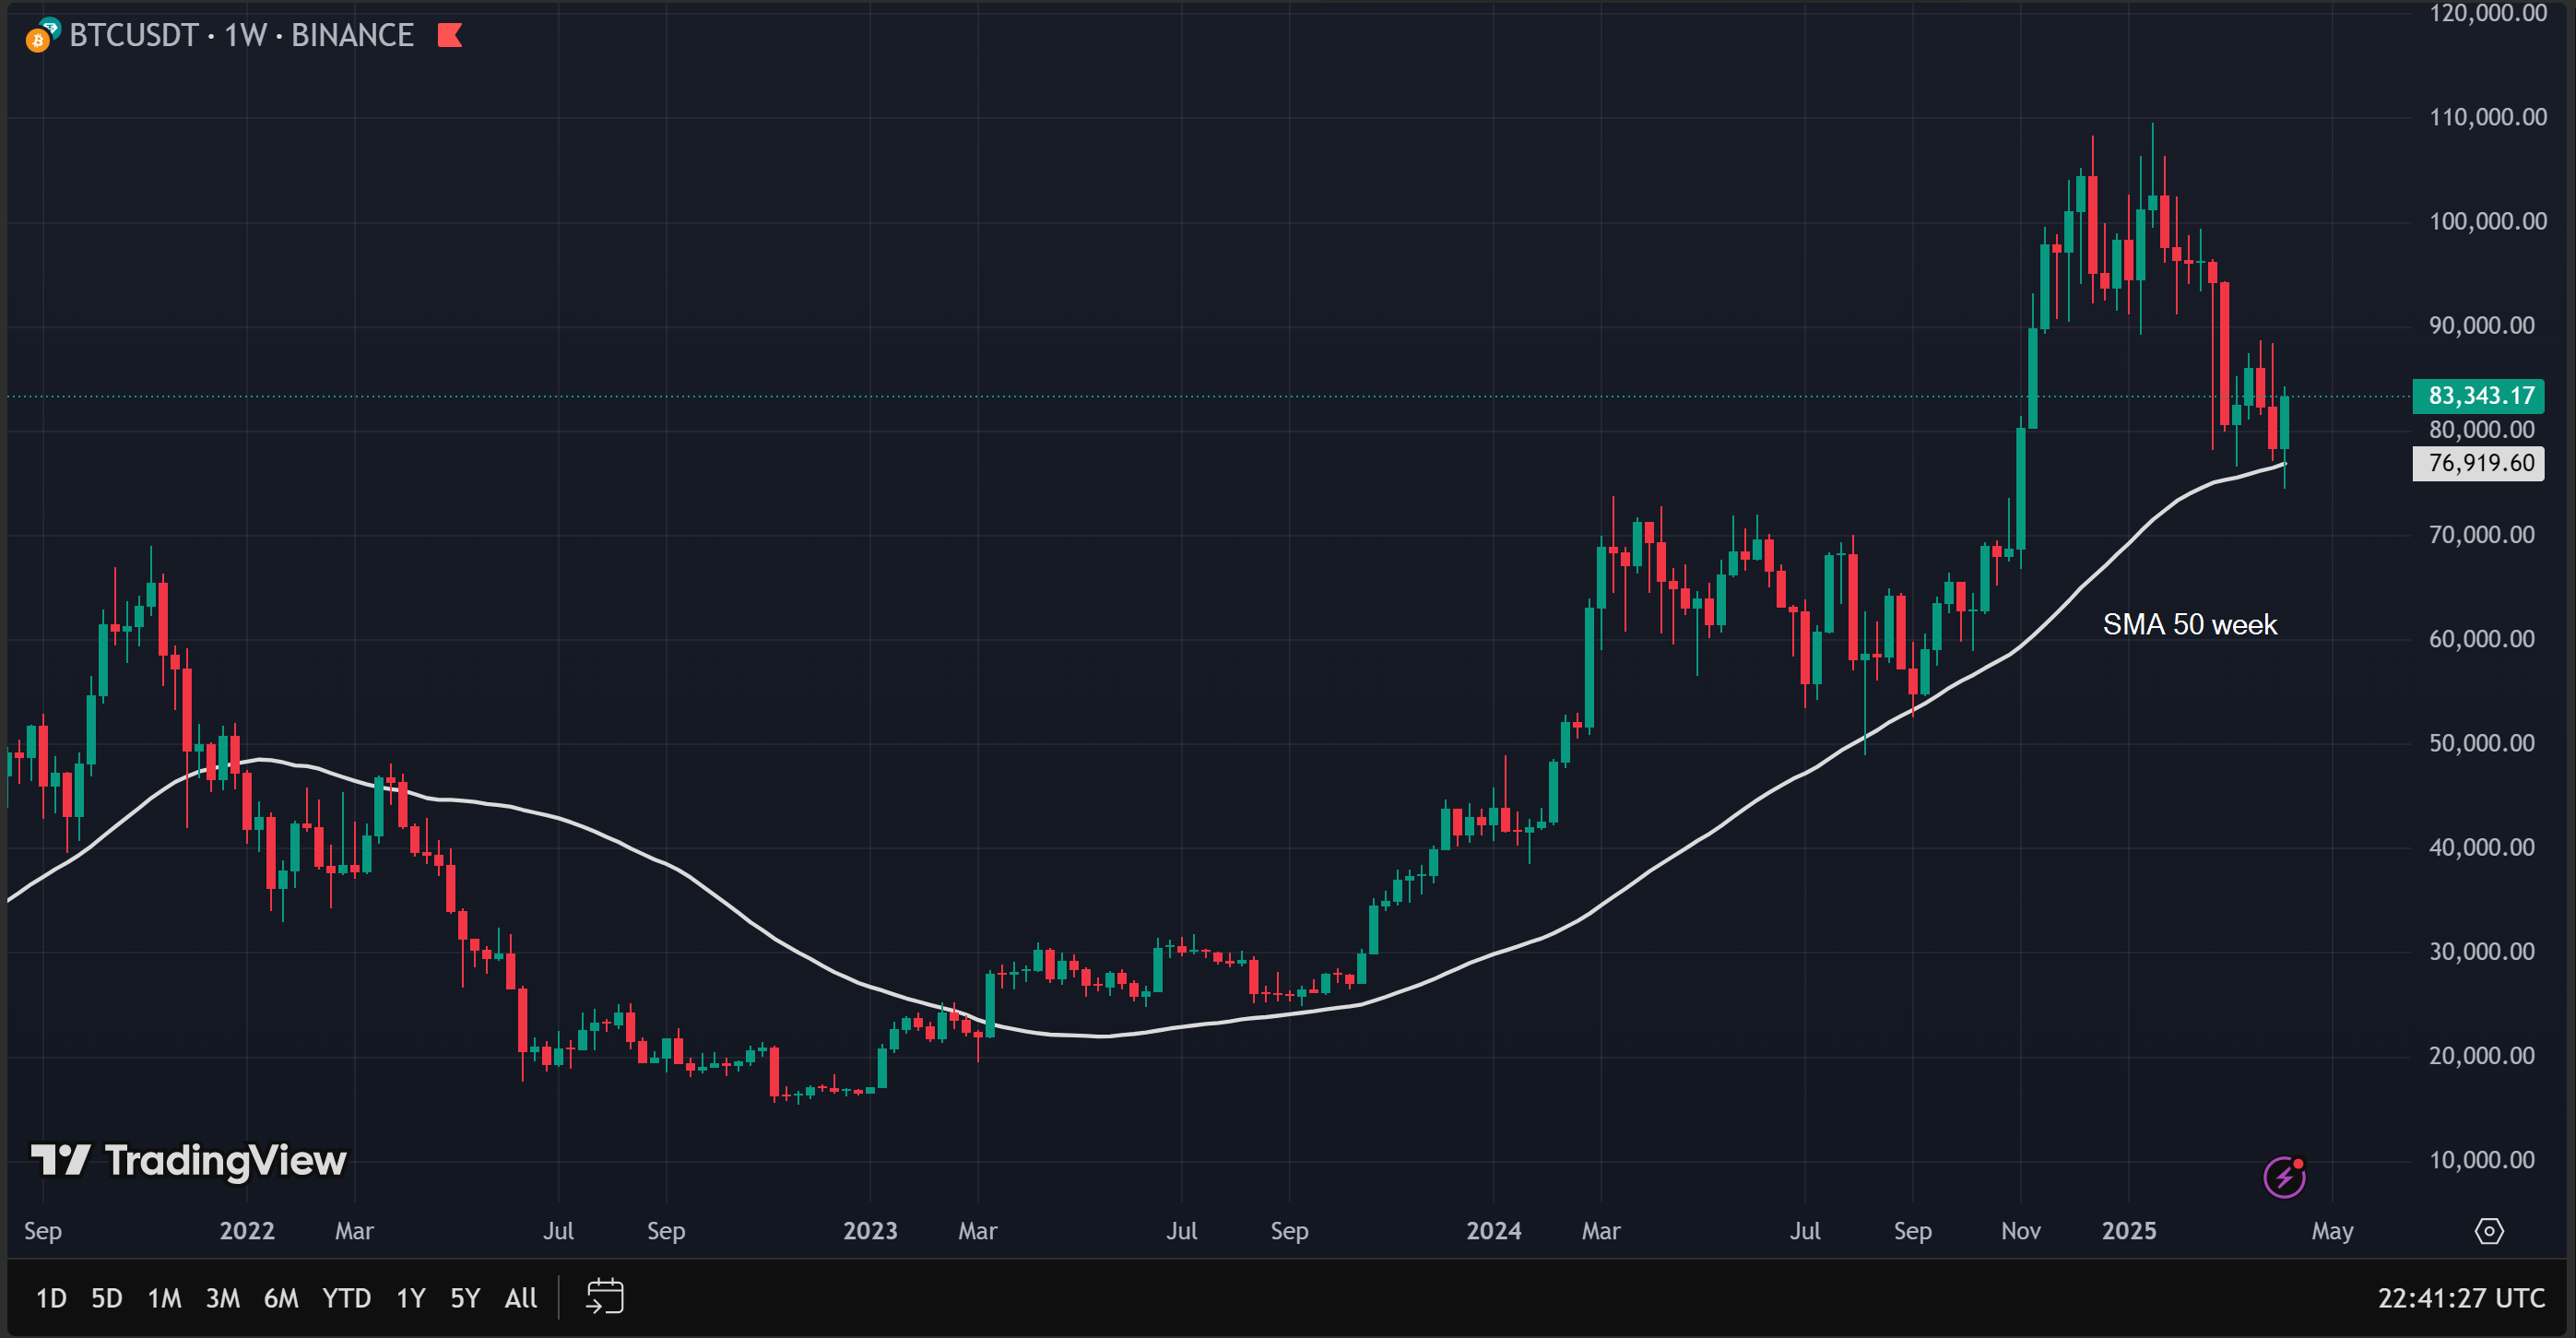
As shown in the chart below, Bitcoin continues to trade above its 50-week Simple Moving Average (SMA)—a key long-term trend indicator. The recent bounce from this level reaffirms its role as dynamic support and underscores the strength of the prevailing bullish structure. While the short-term price action has been turbulent, the larger trend remains intact.
Next Friday
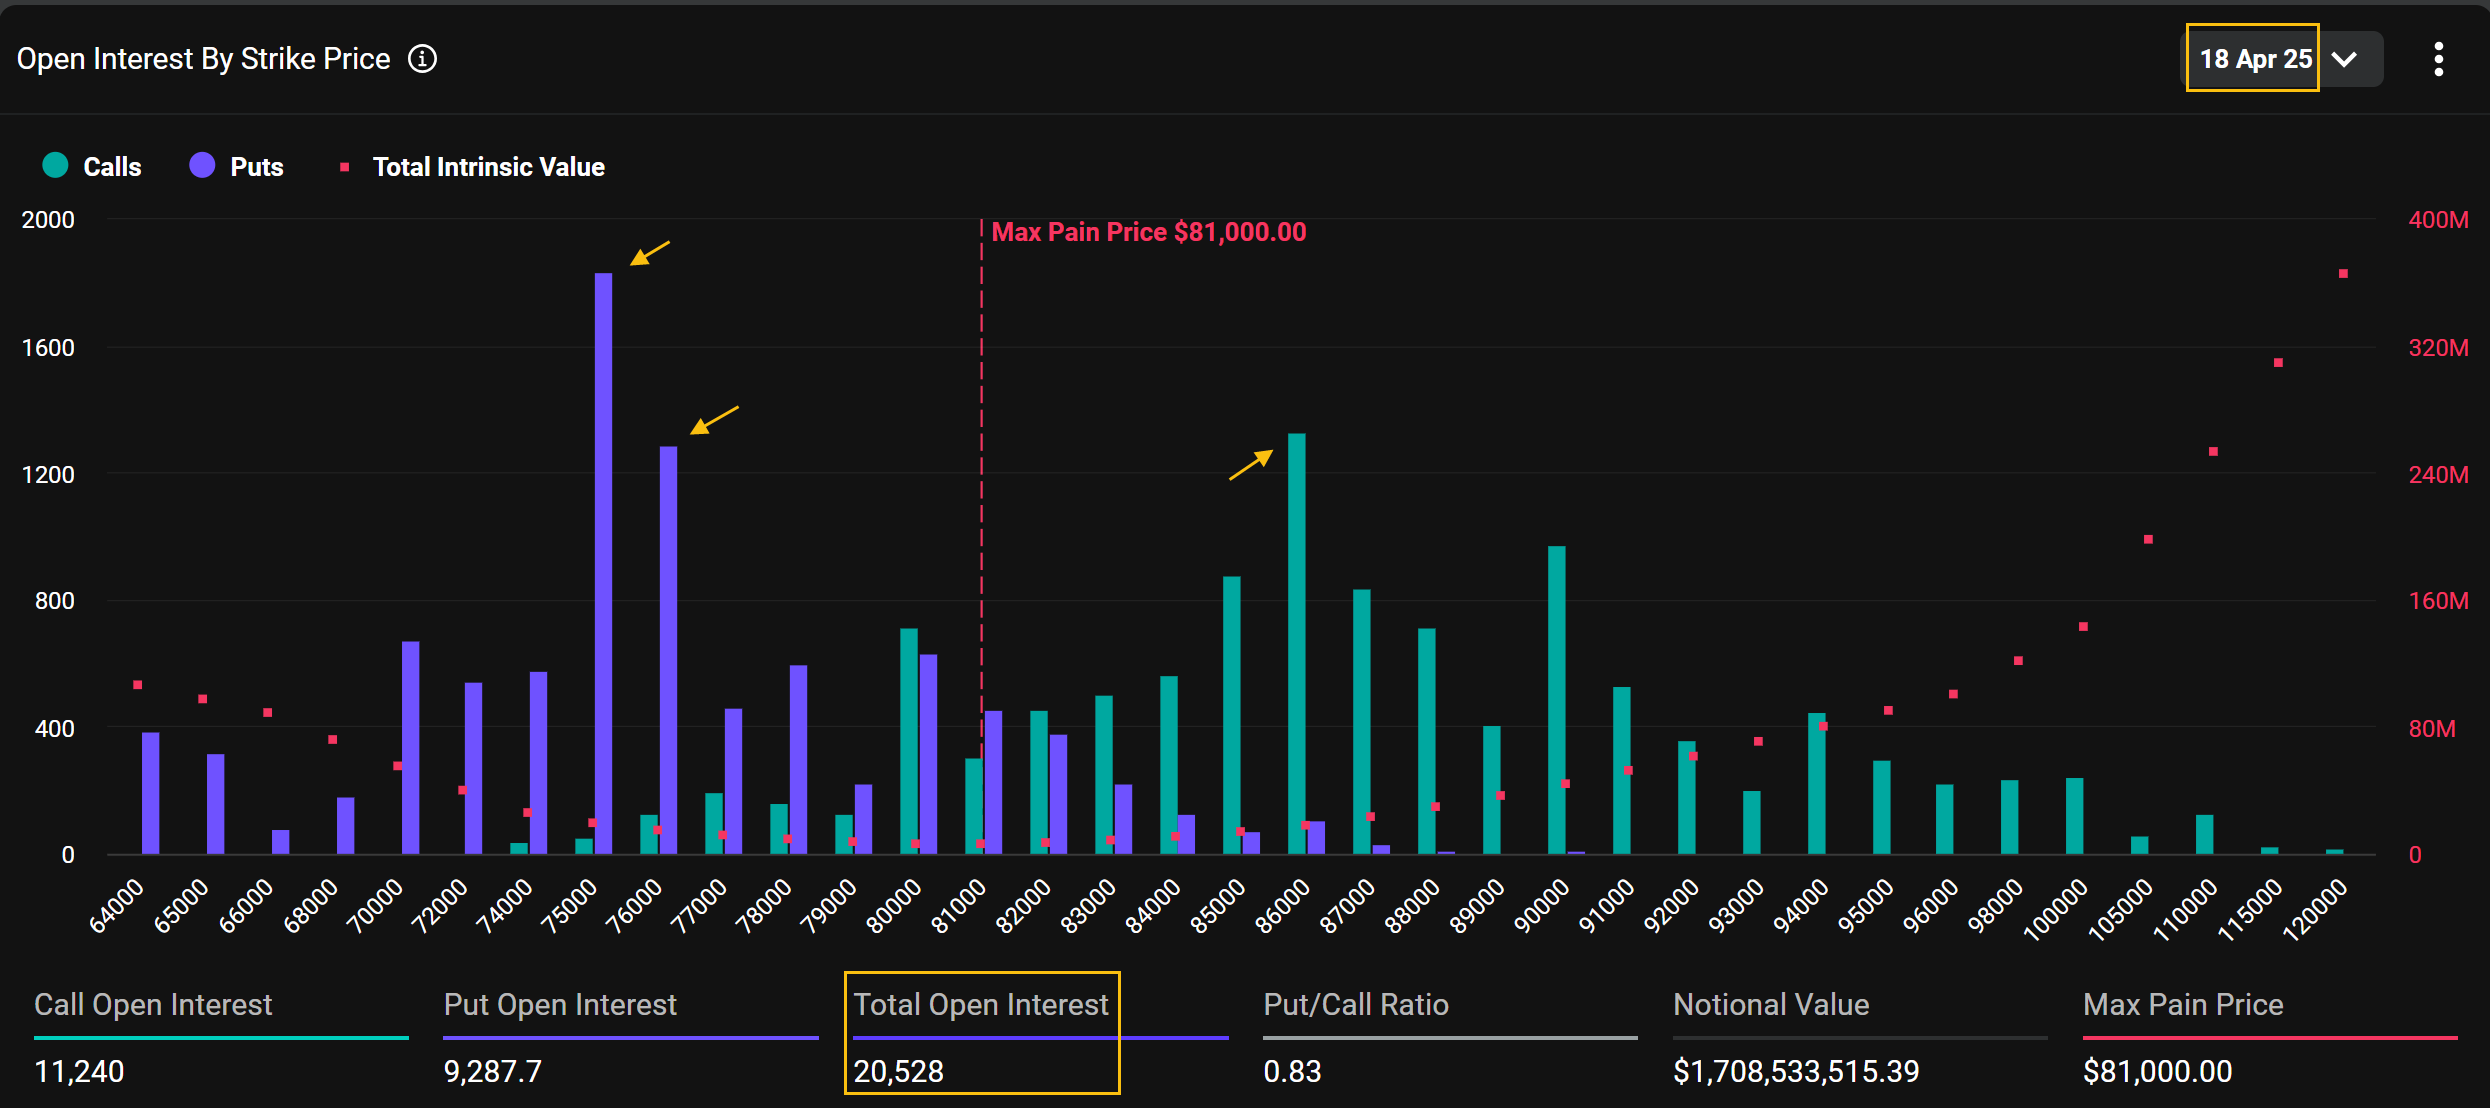
Yet for the upcoming Friday, April 18, the options landscape suggests, still, a more defensive short-term posture. We see relatively stronger concentration on the put side—particularly at the $75,000 and $76,000 strikes—lifting the Put/Call ratio to 0.83. This signals cautious sentiment among traders despite the broader market's optimism. However, the standout call open interest at $86,000 indicates that some market participants are still positioning for a potential upside surprise. These traders seem eager to keep a “bullish ticket” in hand in case renewed momentum pushes Bitcoin sharply higher within the week.
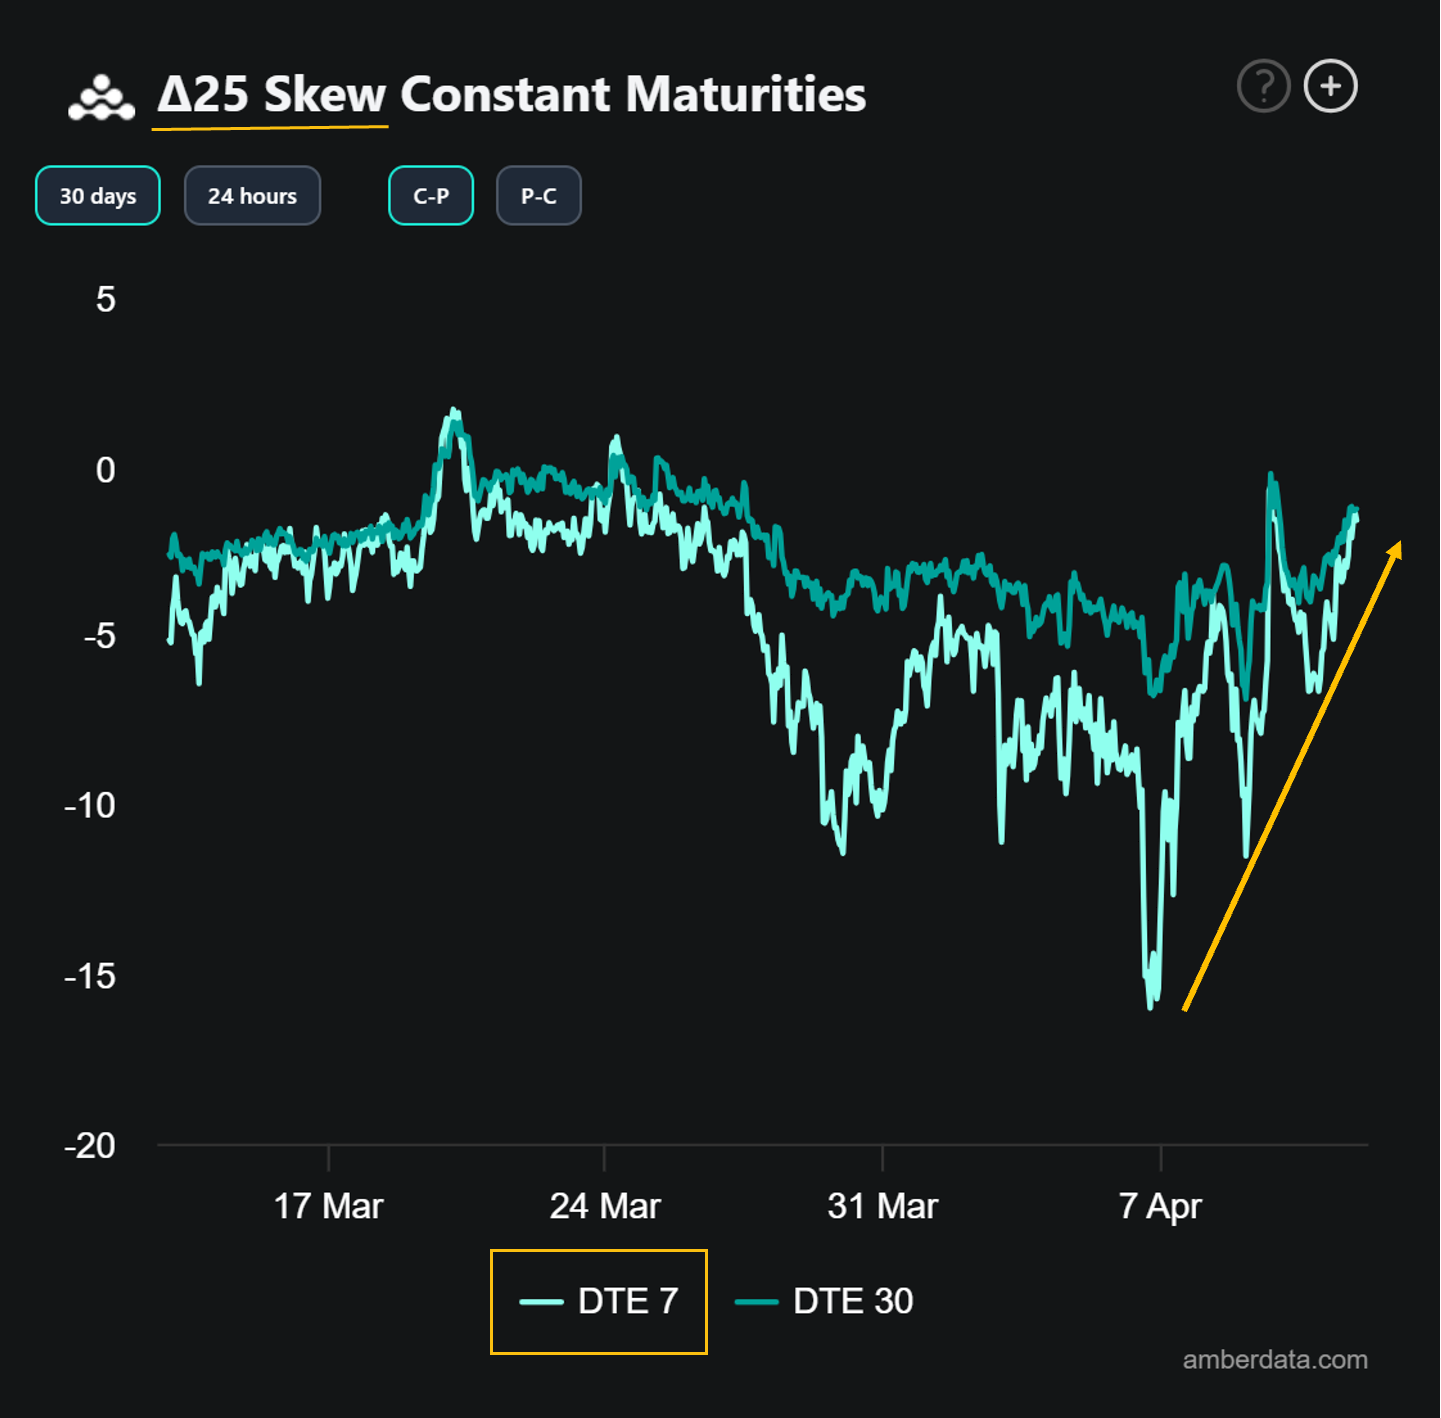
Skew Rebounds as Optimism Creeps In
Recent Activities
Heatmap
(OSS)
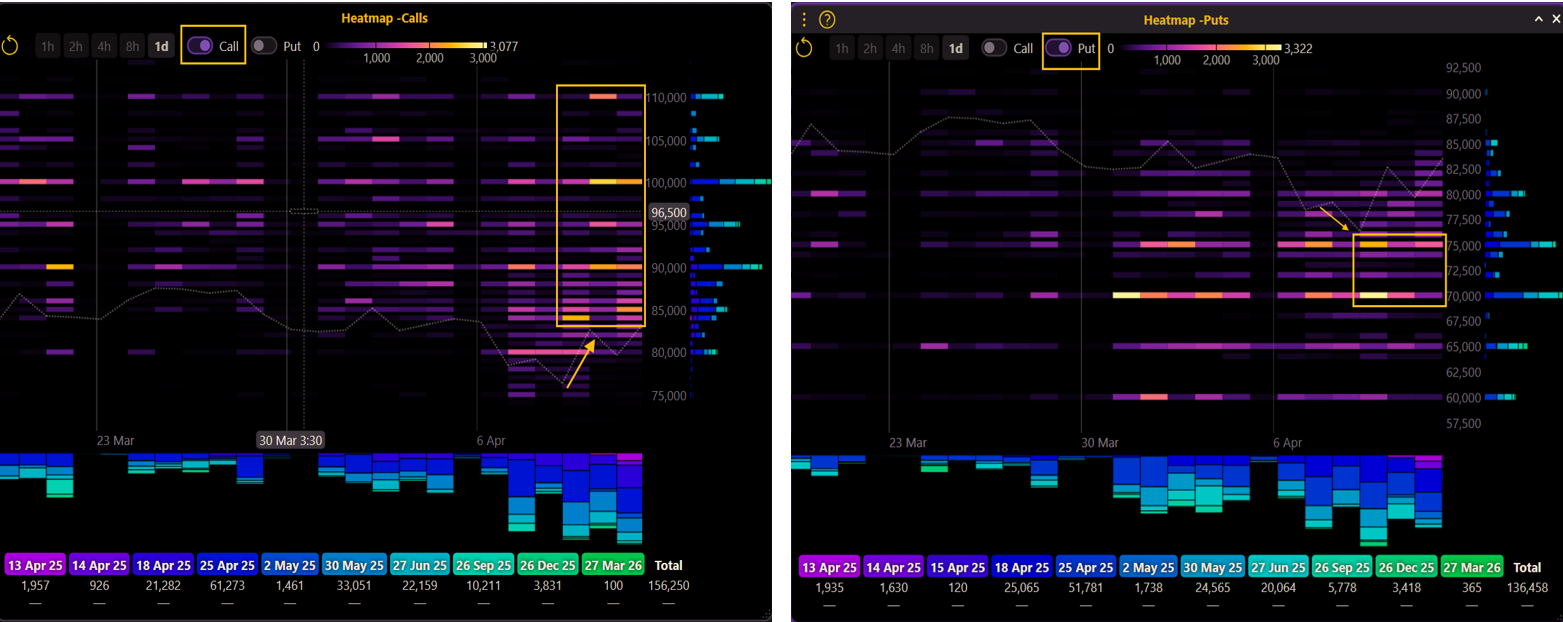
The recent activity on the Thales Heatmap (6–12 April) shows a typical response to shifting price levels. As BTC rebounded toward $80K, trade volumes increased sharply—especially on the call side. Filtering separately for calls (left) and puts (right), we observe a common pattern: shorter expiries (purple) concentrated around at-the-money strikes, while longer-dated expiries (blue and green) skew toward out-of-the-money levels. On the put side, strikes around $70K–$75K drew significant volume as BTC dipped early in the week. Conversely, calls clustered between $85K–$100K, suggesting growing interest in upside exposure. The volume profile indicates a notable uptick in bullish activity, even though the distribution remains orderly and consistent with price movements.
Market Screener
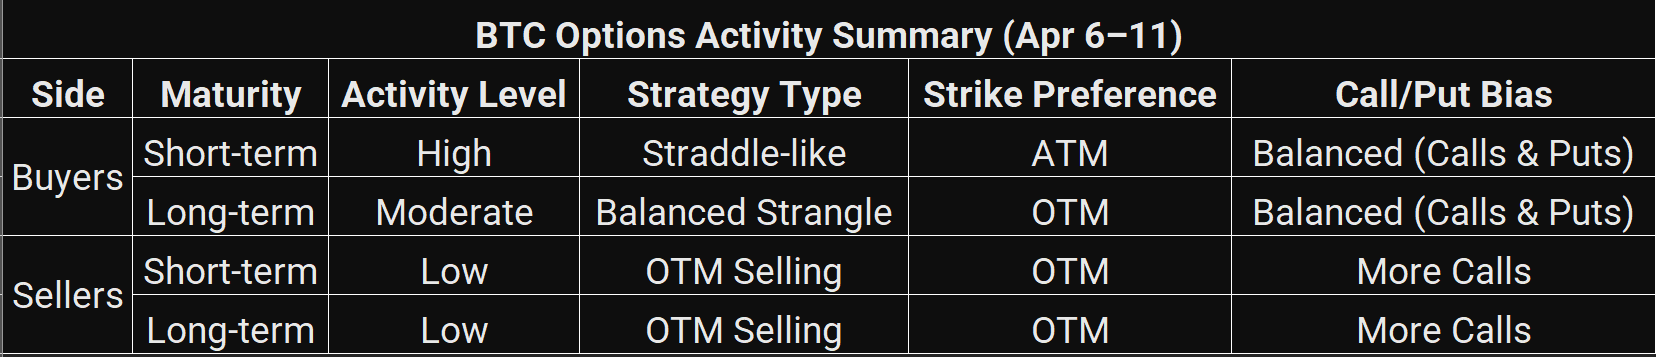
Buyers favored short-term straddles; sellers leaned toward OTM calls with lighter positioning overall.
(OSS)
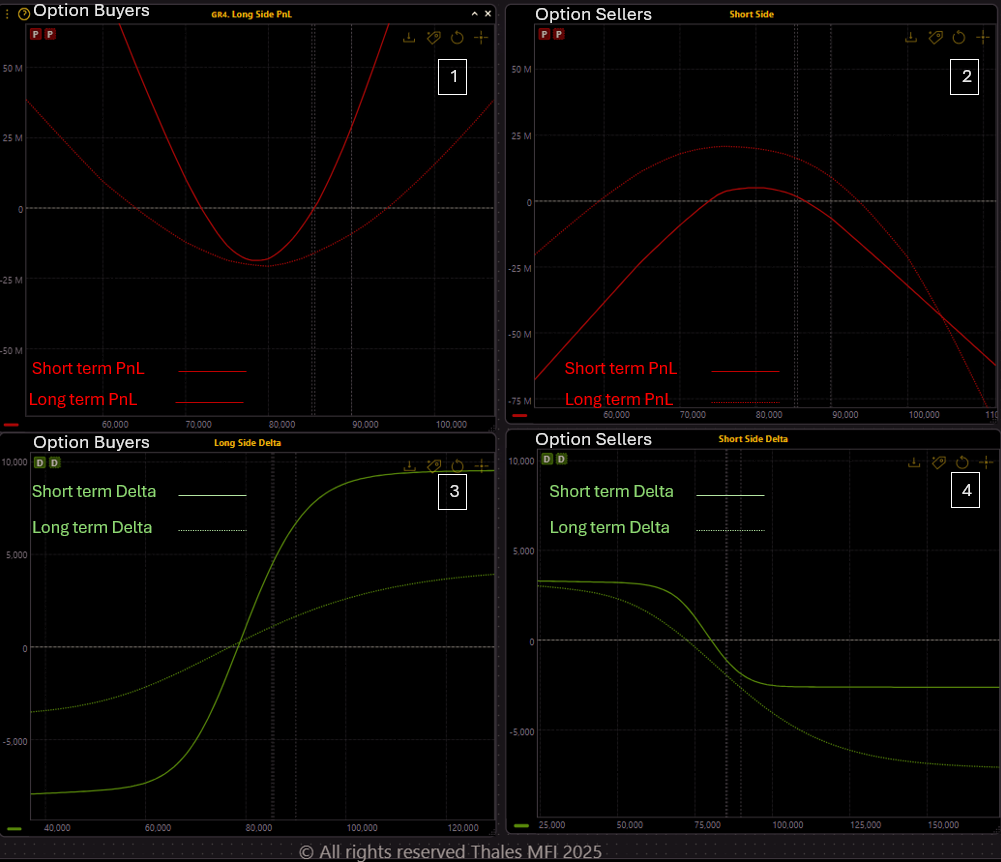
To assess recent trader behavior, we used Thales Market Screener to filter for option trades entered between April 6 and 11. The four-panel chart breaks down the long and short side positions by expiry and type.
Graph 1 shows the PnL of long-side trades. The solid curve represents short-term buyers (April 18 & 25 expiries), whose positions resemble a straddle, suggesting they bought both calls and puts close to the current BTC price. The dotted line represents long-term buyers (May 30 & June 27 expiries), and its wider shape implies a strangle-like structure, indicating preference for out-of-the-money (OTM) calls and puts.
Graph 2 displays PnL profiles for the short side of those same trades. Both short- and long-term sellers appear to favor a wider strike range, avoiding ATM exposure, possibly to manage risk or capitalize on elevated premiums.
Graph 3 gives us the delta profile for the long side. We can clearly see much higher delta values for short-term contracts, confirming that buyers were more active on this side.
Graph 4 highlights the delta for short-side trades. One key insight: the delta of short calls is noticeably larger than short puts, especially for longer expiries. This indicates a preference for selling OTM calls—either to take advantage of relatively richer premiums (due to skew), or as part of bullish call spreads, where the short leg involves selling higher-strike calls.
Altogether, the data suggest that in this window, traders leaned toward buying volatility near the spot in the short term, while longer-term activity tilted toward structured spreads or strangles, with sellers showing more comfort offloading upside risk.
Strategy Spotlight
Bull Call Spread
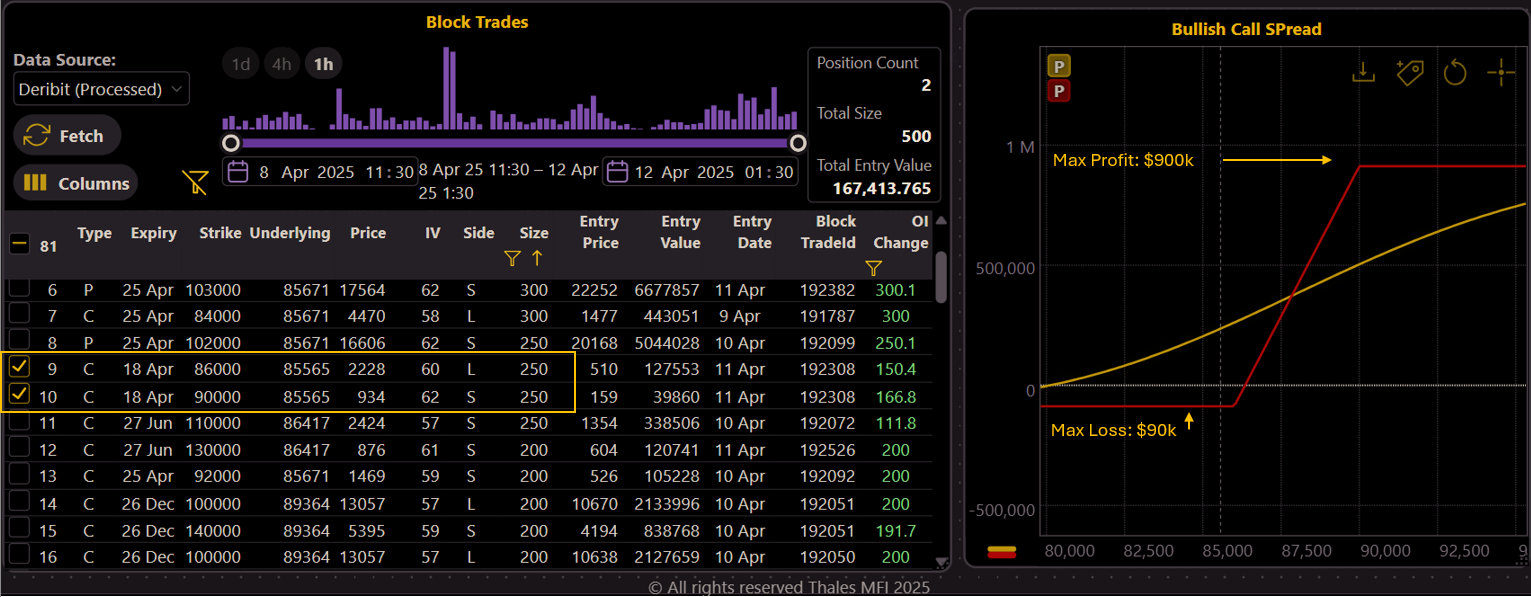
Block trade on April 11: 500 BTC spread between $86K–$90K strikes, targeting moderate upside with limited risk.
(OSS)
This week’s highlighted strategy from the Market Screener is a Bull Call Spread, executed as a block trade on April 11 with a total size of 500 BTC (250 contracts per leg) expiring on Friday, April 18. The structure involves buying 250 call options at the $86,000 strike and selling 250 calls at $90,000, reflecting a directional bet that Bitcoin will rise but stay below $90K by expiry. This setup caps the maximum gain at $900K, with a limited maximum loss of $90K, and a breakeven at $86,400.
Bull call spreads have appeared rather frequently in recent sessions—this one stands out as a clean example of traders positioning for a moderate upside in the short term. Whether it lands in the green or not, we’ll find out by next Friday.
Bottom Line
The Bitcoin options market continues to walk a tightrope—balancing renewed optimism with lingering caution. Last week’s expiry once again rewarded sellers, yet the concurrent rise in price and implied volatility marks a notable shift in sentiment. Traders are beginning to re-engage on the upside, as seen through rising skew, heavier call activity, and structured long positions built near the spot. At the same time, downside protection remains in place, especially in the near term.
This week’s activity reflects a market preparing for movement—potentially higher, but not without hedges. Whether this is the early stage of a larger bullish leg or just another volatile pause remains to be seen. What’s clear is that positioning is evolving. And in options, positioning is the signal.
Disclaimer
This report is for informational purposes only and does not constitute financial advice. All views are based on publicly available data and market analysis at the time of writing. Please conduct your own research or consult a qualified advisor before making any trading decisions.