Introduction
The Bitcoin options market has entered a quieter stretch—but don’t let the calm fool you. While last week’s expiry closed stronger than many anticipated, the broader narrative is one of fading momentum and rising caution. Implied volatility has retreated, funding rates have leveled, and skew metrics point to a market that’s unsure of its next move.
In this Outlook, we dissect the cooling sentiment behind the April 18 expiry, track the ebb in volatility, and analyze what traders are (and aren’t) pricing in for the high-stakes April 25 expiry. From Heatmap clusters at key psychological levels to the positioning breakdown revealed by the Market Screener, we piece together a market leaning cautiously neutral—yet still tactically active.
We close with a sharp Bear Put Diagonal Spread found on the tape, signaling that at least some players are quietly preparing for downside in early May. Let’s take a closer look at how Bitcoin options traders are positioning themselves in this shifting landscape.
Market Snapshot
April 18 Expiry Recap
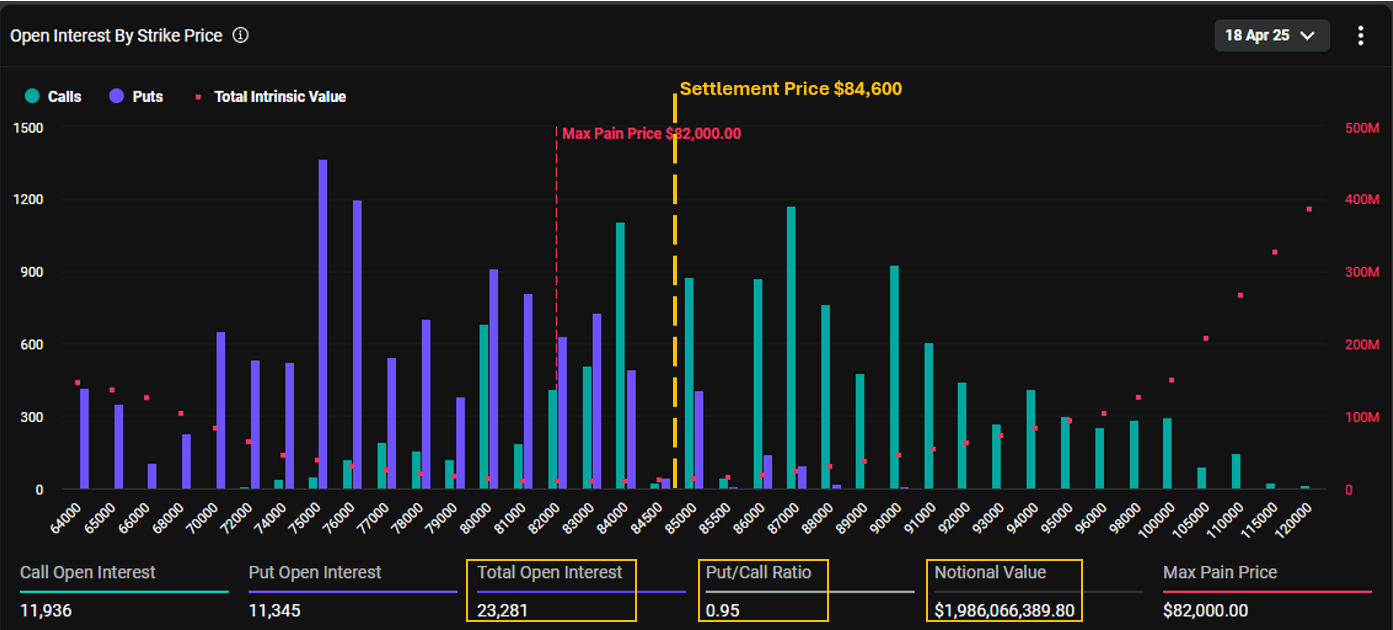
Despite a relatively high Put/Call ratio of 0.95 and more than 23K open contracts, this Friday’s expiry settled at $84,600—well above the $82,000 max pain level. The largest concentration of puts at the $75K–$76K strikes expired worthless, indicating that the week closed stronger than many option traders had positioned for. Still, it wasn’t a full win for call buyers either—all strikes above $85K remained out of the money. Only marginal, near-the-money calls may have delivered a profit, depending on entry price and timing.
Implied Volatility Retreats as Market Cools Off
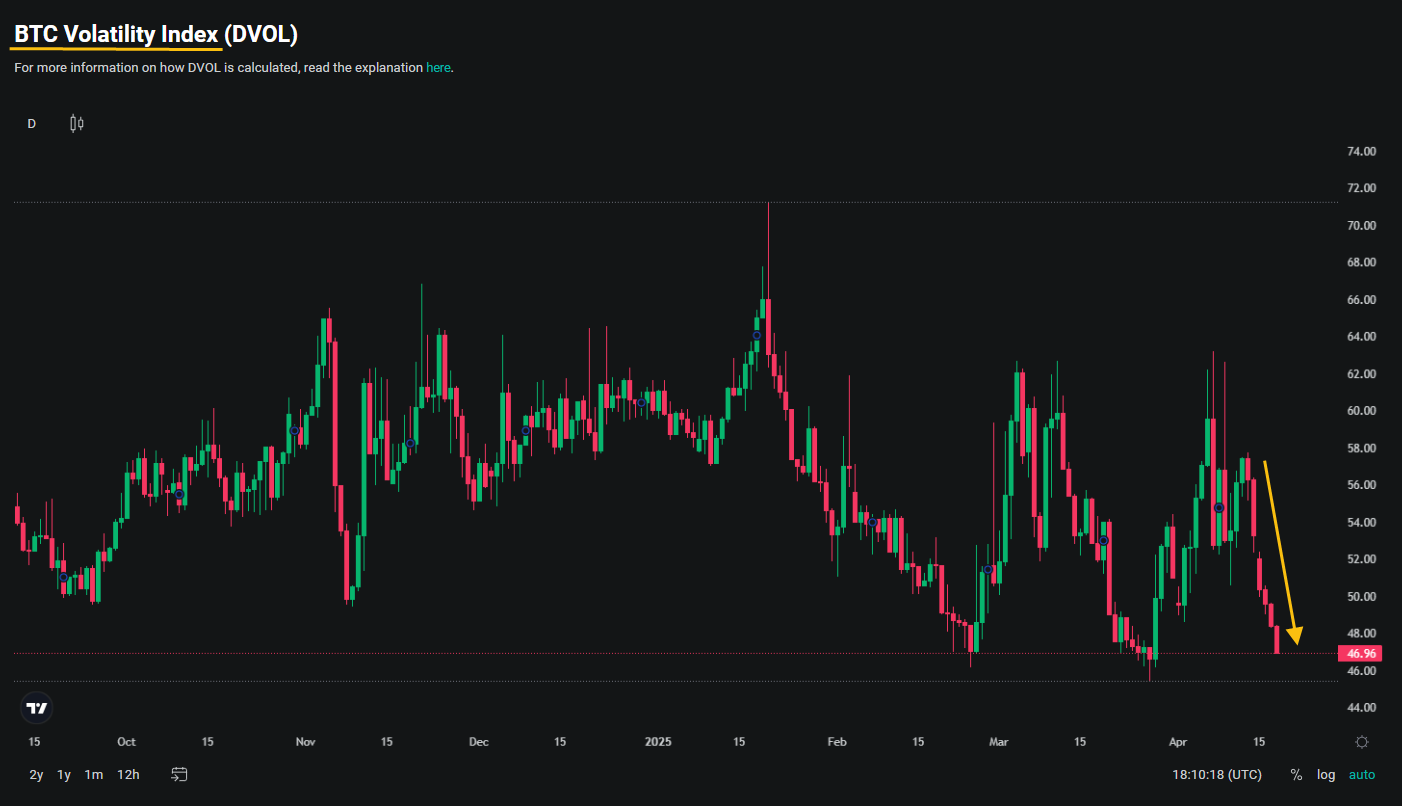
With Bitcoin trading in a relatively tight range between $83K and $86K throughout the week, the excitement that briefly returned to the market has once again faded. The Deribit Volatility Index (DVOL) has dropped sharply, returning to its recent lows around 47%. It seems that traders no longer expect significant short-term price swings, and the options market has entered a quieter phase. As long as BTC hovers above $80K without clear momentum, the prevailing sentiment appears to be one of cautious calm.
BTC Perpetual Funding Rate – Signs of Fading Momentum
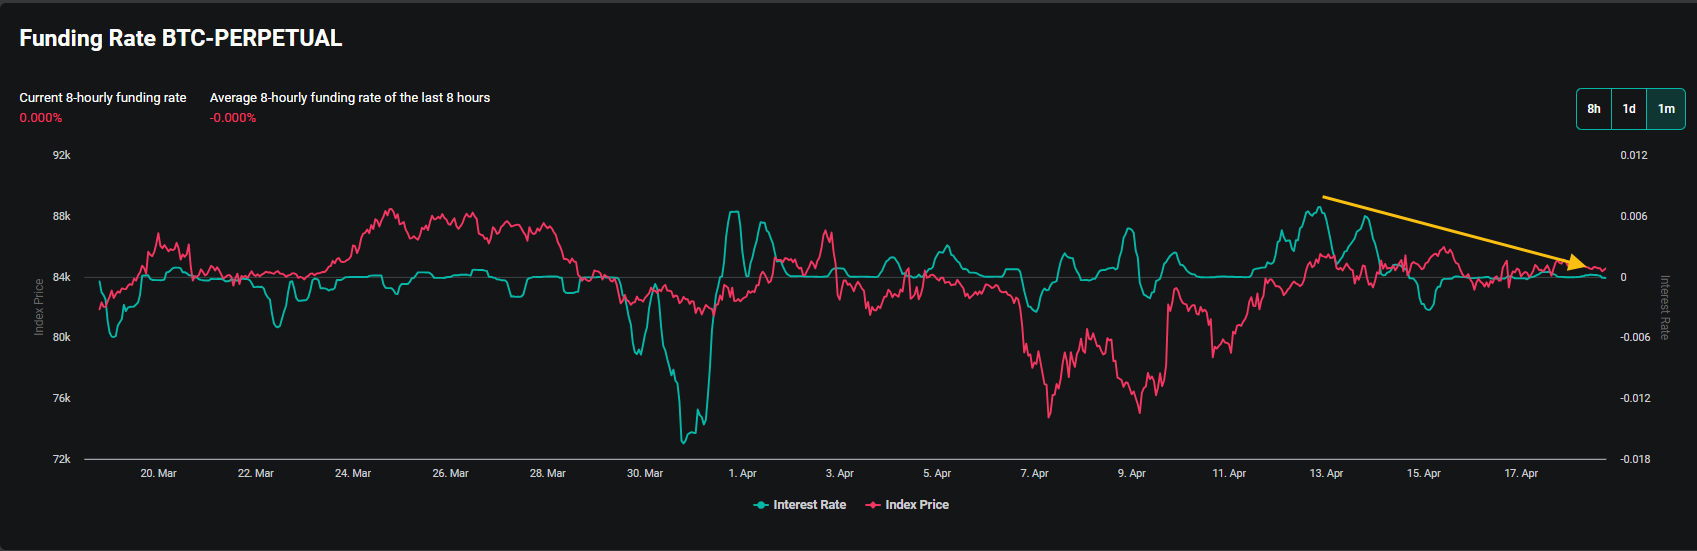
The recent calm in market sentiment is mirrored in the perpetual futures market as well. Earlier in the week, the funding rate (green line) rose briefly alongside Bitcoin’s price (red line), reflecting renewed enthusiasm. However, that momentum gradually faded, with the rate flattening back to neutral. This return to balance suggests a pullback in speculative activity from retail traders and a slowdown in hedging from larger players.
Next Friday
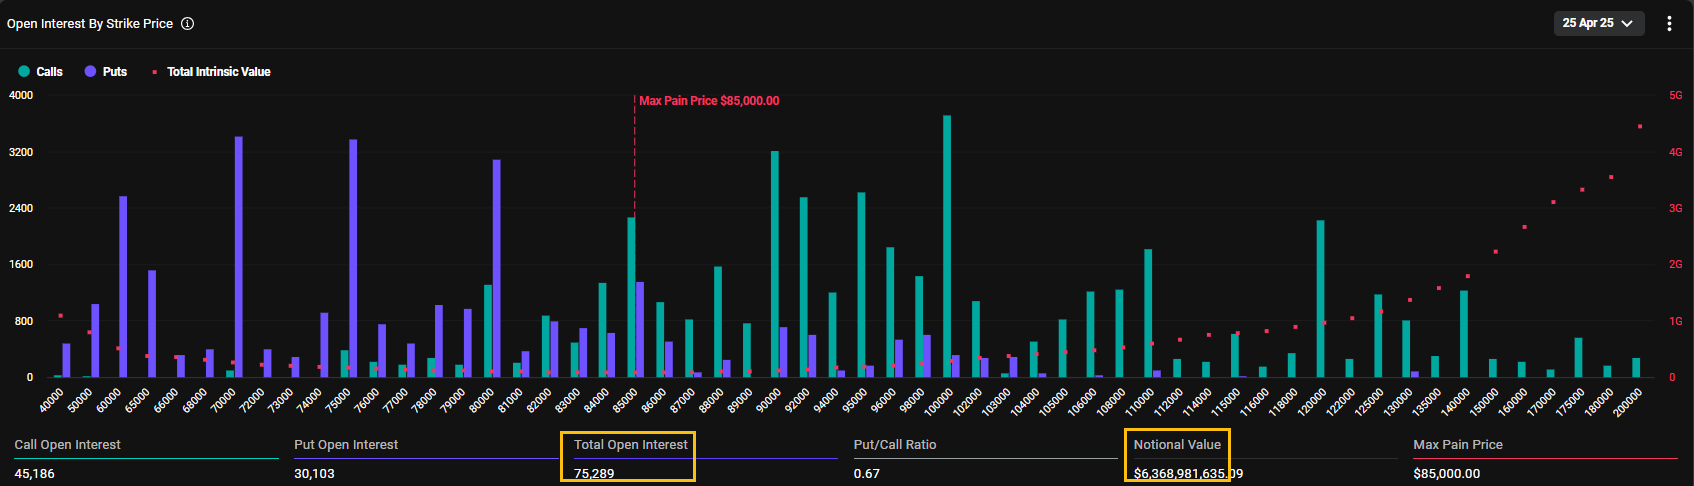
Next Friday marks a major expiry, with over 75,000 open contracts and more than $6.3B in notional value—making it one of the most significant expiries on the board. Yet, despite its size, most of the outstanding call and put positions remain far from the current market price near $85,000, which also aligns with the max pain level. With just one week remaining, option buyers are not sitting in a comfortable spot—many positions are still deep out-of-the-money, leaving sellers in a stronger position as time decay accelerates.
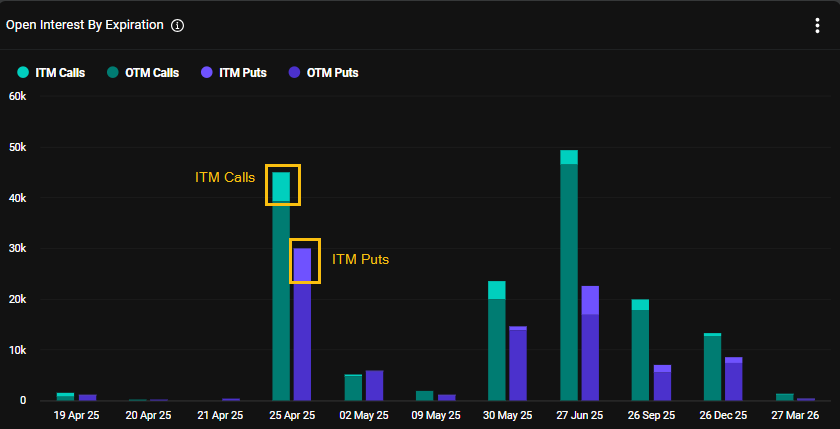
As shown in the chart above, with just one week left to the April 25 expiry, a relatively small portion of contracts are currently in-the-money—suggesting that a large share of positions still rely on a significant price move to realize value.
Skew Returns to Neutral: No Clear Bias in Option Pricing
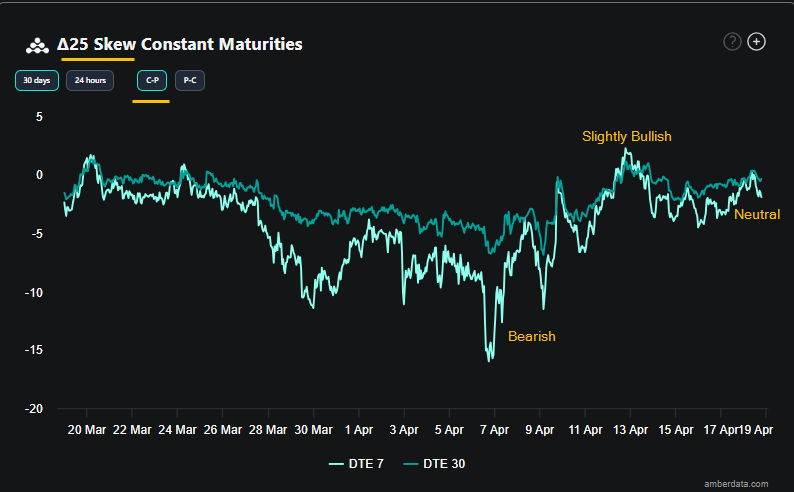
After a period of bearish sentiment—largely triggered by the tariff war—and a brief tilt toward bullishness earlier this week, the market has now reverted to a more neutral stance. This is clearly reflected in the 25-delta skew chart above. The short-term skew (light green line, 7 DTE) has retraced back toward zero, indicating that implied volatilities for calls and puts are now nearly balanced. In other words, Bitcoin options traders are no longer showing a significant bias in either direction. Both short-dated and longer-dated 25-delta options are pricing in similar IVs, suggesting indecision rather than conviction.
Recent Activities
Heatmap
(OSS)
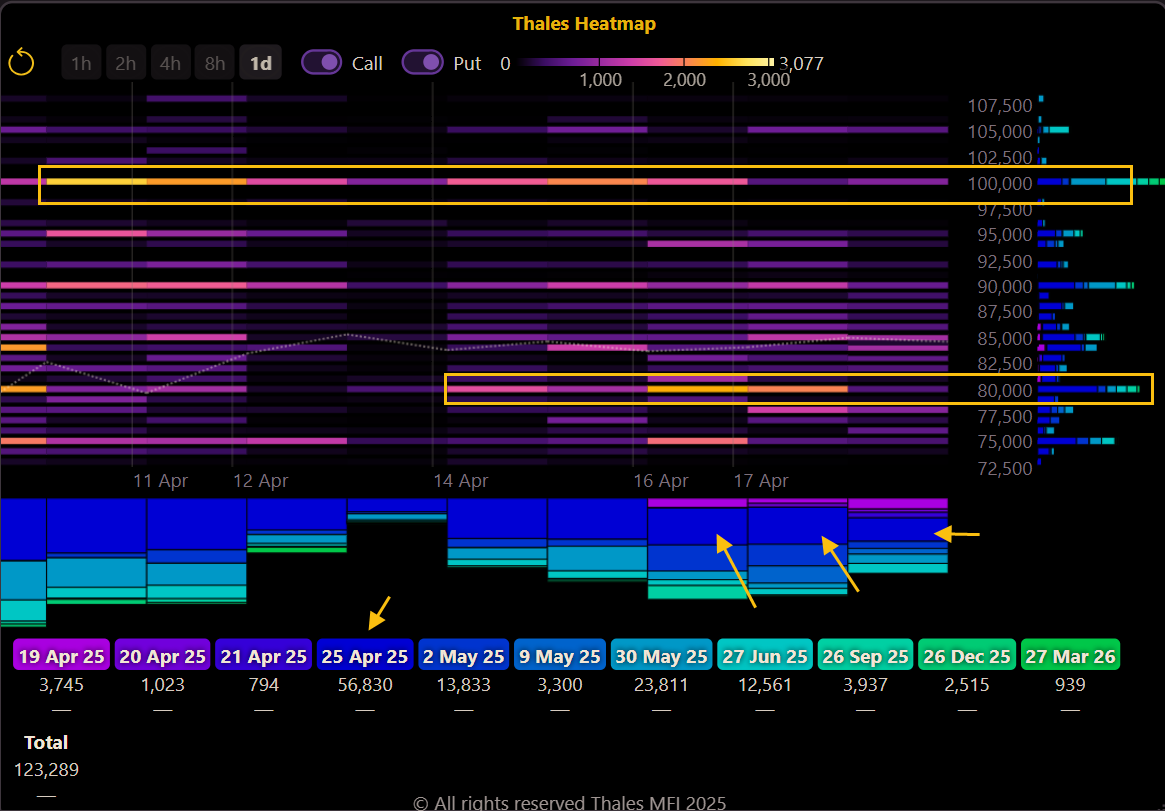
A glance at the Thales Heatmap confirms where the action was this week: options at the $80K and $100K strikes drew the most attention, particularly for the April 25 expiry. These levels stood out as liquidity hubs, with concentrated trading volume visible in the horizontal bands. The color-coded expiry tags—dark blue for April 25, light blue for mid-term dates, and green for long-dated expiries—make it clear that short-term contracts dominated the flow. This pattern suggests a conservative stance from traders, favoring well-established psychological levels rather than speculative extremes.
Market Screener
(OSS)
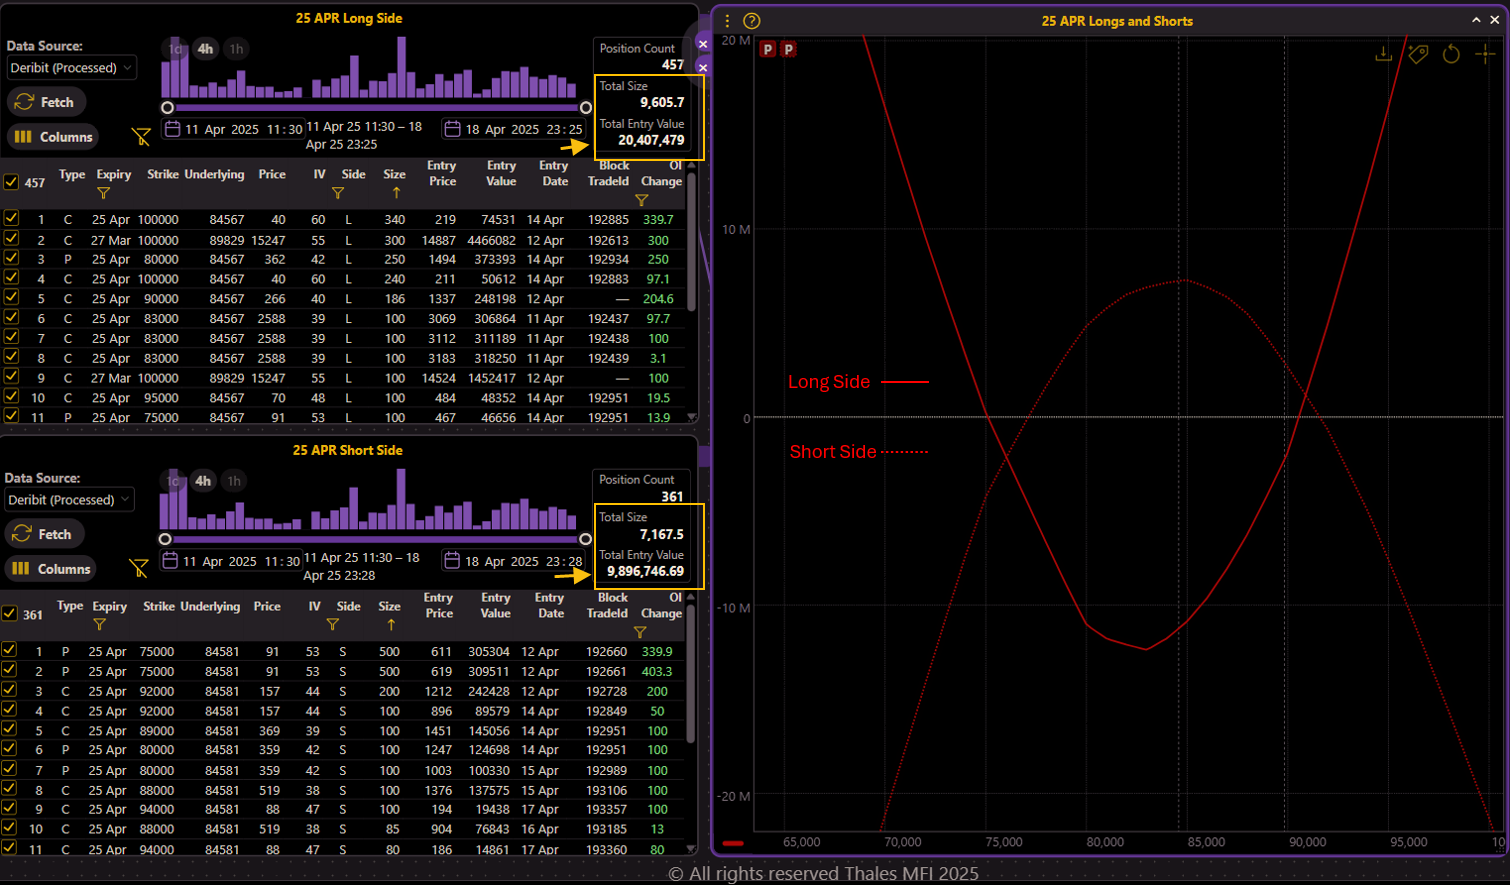
To better assess this week’s Bitcoin options activity, we turned to the Thales Market Screener, applying filters for trades entered between April 11 and April 18. The top panel displays the long-side entries, while the bottom shows the short-side positions. On the right, the combined PnL graph—solid line for longs, dotted for shorts—offers a comparative view of positioning across both sides of the market.
The aggregated exposure suggests that both buyers and sellers largely focused on strikes around the current BTC price of ~$85,000, avoiding far out-of-the-money levels. From a premium perspective, long-side traders deployed over $20M in capital for roughly 9.6K options, while sellers collected around $9.9M across 7.1K contracts.
Strategy Spotlight
Bear Put Diagonal spread for Eearly May
(OSS)
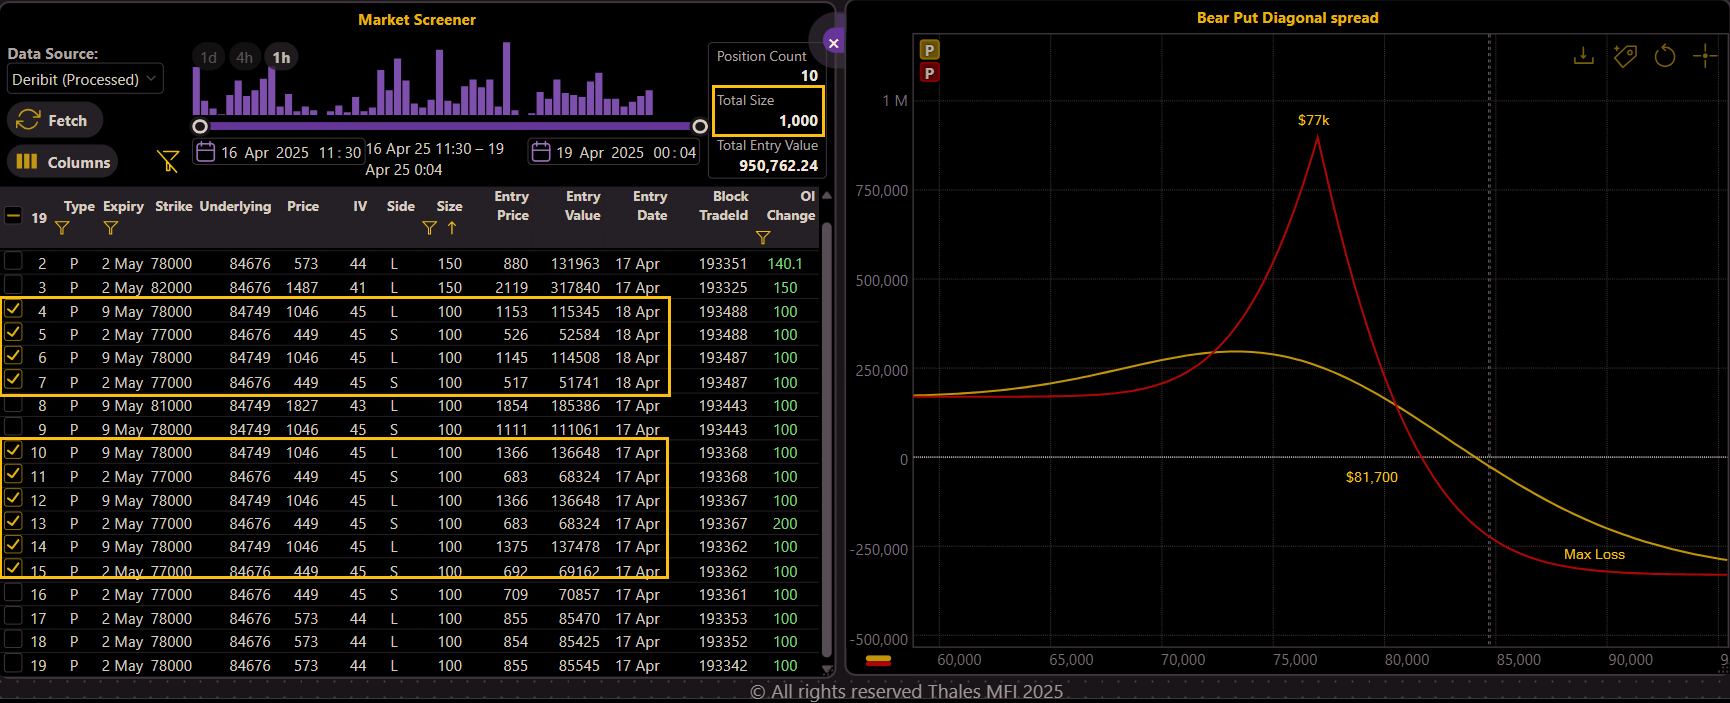
A Bear Put Diagonal Spread surfaced on our Market Screener this week as a block trade with a total volume of 1,000 BTC. The structure involves buying 500 put options at the $78,000 strike expiring on May 9, while simultaneously selling 500 puts at the $77,000 strike expiring a week earlier, on May 2.
This setup combines elements of a traditional bear put spread with a calendar spread—taking a directional bearish stance while also benefiting from time decay on the short leg. As the PnL chart shows, the strategy reaches its maximum profit if BTC trades at $77,000 at the earlier expiry (May 2). The breakeven is at $81,700, with a maximum potential loss of $330,000 occurring if Bitcoin rallies beyond that level.
The trade suggests a bearish short-term outlook: ideally, BTC hovers around $77K by May 2 (so the short leg expires worthless), and then continues to drift lower heading into the May 9 expiry. The sold leg helps reduce upfront cost and accelerates time decay in the trader’s favor.
While this strategy reflects a tactical play on downside movement, it's just one of many narratives shaping the market—and as always, nothing is guaranteed.
Bottom Line
After a surprisingly strong weekly close, the Bitcoin options market now finds itself in a holding pattern. Implied volatility has softened, funding rates have flattened, and skew has normalized—signs of a market pausing to reassess. With April 25 shaping up as a major expiry, most open positions remain far from profitability, favoring sellers as time decay accelerates. While the overall tone is neutral, tactical plays like the Bear Put Diagonal Spread suggest that some traders are quietly positioning for weakness into early May. The stage is set for movement—if not in direction, then in conviction.
Disclaimer
This report is for informational purposes only and does not constitute financial advice or a recommendation to trade. Options involve risk and may not be suitable for all investors. Always conduct your own research or consult a qualified advisor before making trading decisions.