Introduction
As Bitcoin drifts between $95,000 and $98,000, the options market is once again finding its footing after a series of meaningful expiries. Volatility remains subdued, but sentiment is beginning to shift. From deep structural recalibrations to subtle signals of renewed bullish intent, the current positioning reveals more than meets the eye.
In this week’s Outlook, we examine the recent expiry dynamics, key gamma levels, open interest build-up, and where short-term and long-term flows are converging. A closer look at skew and volatility tells us how cautious optimism is shaping premiums, while new positioning across May and July offers insights into what traders might be preparing for.
Explore these market dynamics firsthand with the Thales Options Strategy Simulator (OSS)
Market Snapshot
Expiry Recap – 2 May 2025
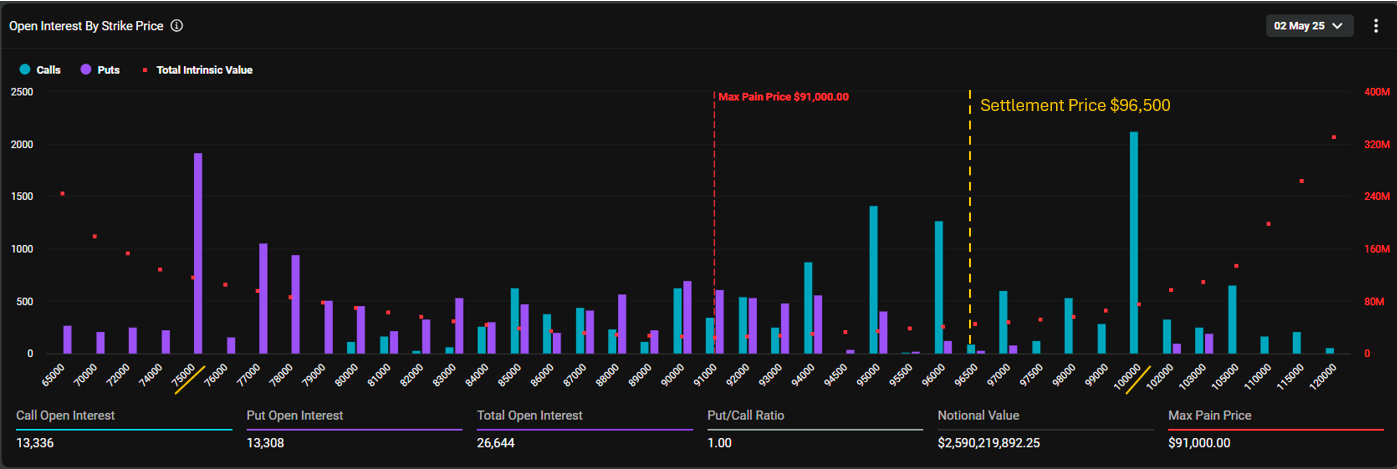
May 2 expiry settled at $96.5K, above max pain at $91K.
Bitcoin's 2 May expiry concluded at $96,500, surpassing the max pain level of $91,000. Despite the upward settlement, the expiry was relatively modest, with approximately 26,000 open contracts. Notably, both the $75,000 put and $100,000 call—key strikes in terms of open interest—expired worthless.
A striking feature of this expiry was the Put/Call ratio reaching 1.00, a deviation from the typical ~0.5. This elevated ratio suggests a market leaning towards defensive positioning, possibly anticipating downside risks.
Gamma Dynamics and Market Reaction
Leading up to expiry, the $95,000 strike became a technical flashpoint, marked by pronounced gamma short exposure among market makers. As Bitcoin’s price approached this level on 1 May, dealer hedging flows accelerated, acting as a catalyst that helped propel the price upward toward $97,000. However, this mechanically driven momentum fell short of breaching the key $100,000 call wall, which remained untouched into expiry.
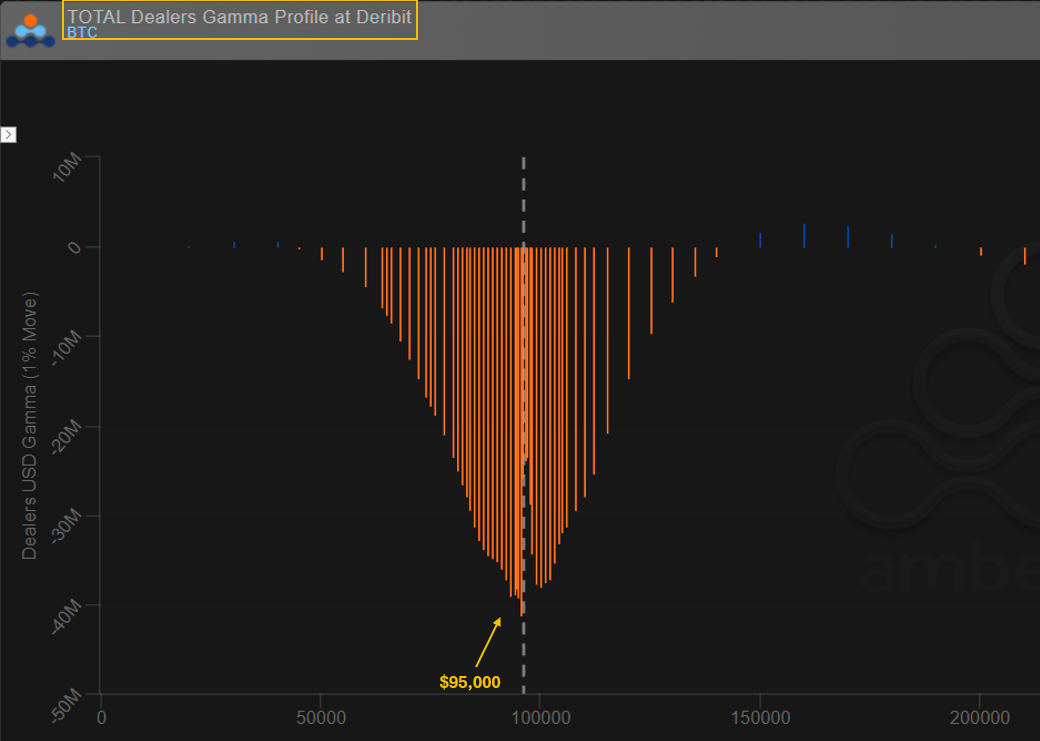
Dealers were short gamma near $95K, triggering hedging flows that pushed BTC toward $97K.
Importantly, $95,000 continues to stand out on the gamma profile. Dealers remain short gamma at this level, meaning if spot drifts back toward it, hedging flows may once again amplify price action in either direction. Whether the market breaks higher or rejects lower could largely depend on how price interacts with this structurally sensitive zone in the coming sessions.
A Calm Options Market Before the Next Build-Up
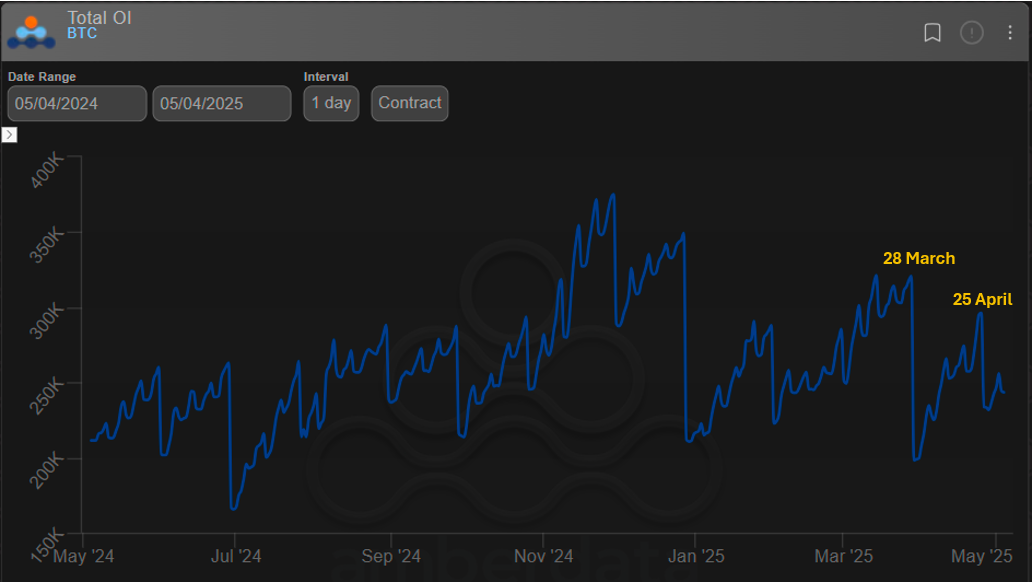
Post-expiry calm: OI dipped after April expiry but is likely to rebuild heading into May and June.
Following the sharp unwinding of positions after the 28 March and 25 April expiries, the total open interest in Bitcoin options has entered a relatively calm phase.
OI Distribution
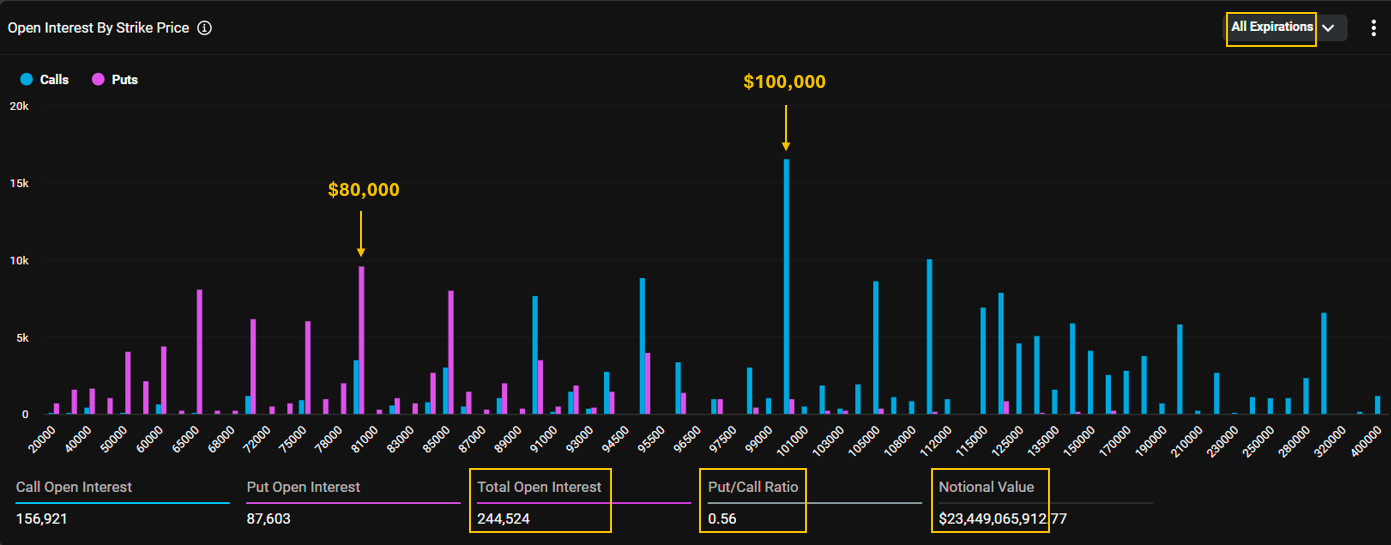
$100K call and $80K put stand out across all expirations; total OI at 244K contracts.
Building on the previous view of aggregate open interest, the chart above shows how OI is distributed across strikes, spanning all expirations. Following the unwind of March and April positions, the market is once again rebuilding, with total open interest now sitting at approximately 244,000 contracts, representing a notional value of $23.5 billion. Notably, the Put/Call ratio has reverted to a more typical level of 0.56, reflecting a balanced landscape.
Open Interest By Expiration
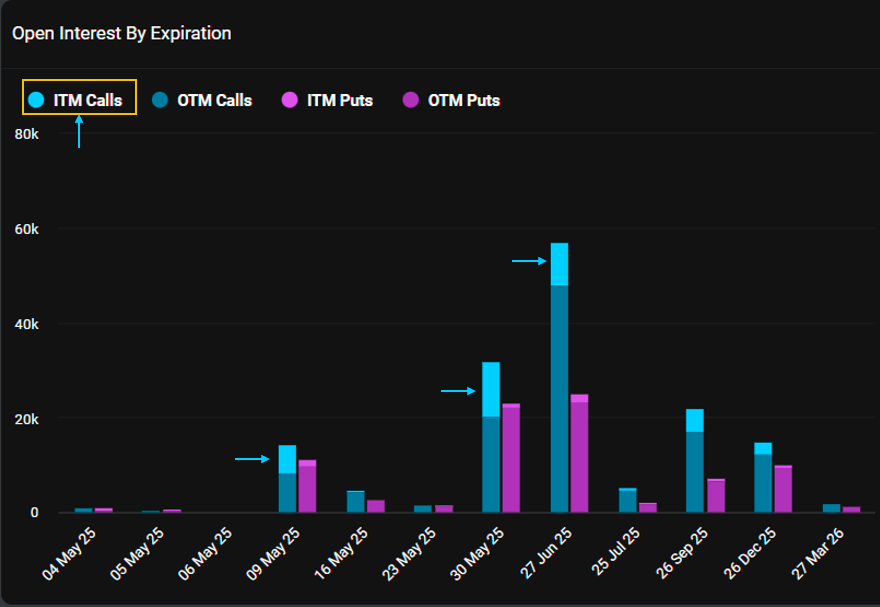
27 Jun, 30 May, and 26 Sep are key expiries; recent price rise dragged many calls ITM.
As shown in the chart above, three expiries currently dominate the landscape: 27 June, 30 May, and 26 September — each attracting meaningful flows. Among nearer dates, 9 May also shows healthy positioning, suggesting a potential pickup in short-term trading activity.
One notable feature of the current distribution is the growing share of in-the-money (ITM) call options, highlighted by the increasing presence of light blue bars. This shift reflects Bitcoin’s recent rally, which has dragged several previously out-of-the-money calls into the money, subtly changing the character of the positioning.
Volatility Drifts Lower as the Market Waits for Direction
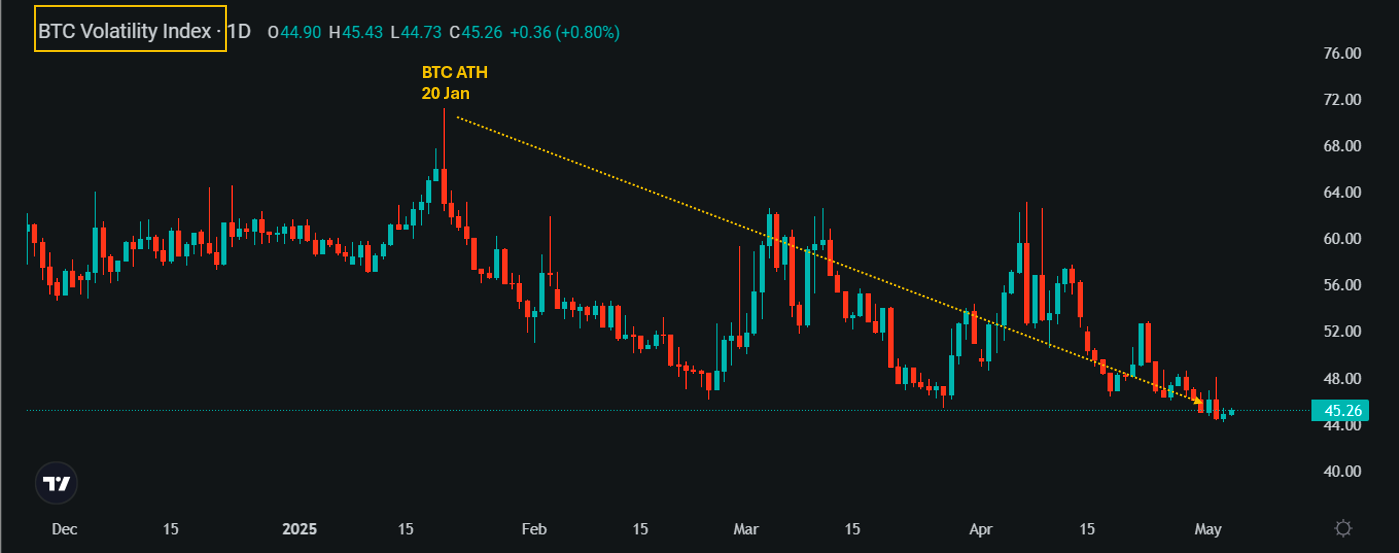
IV remains subdued at 45%; DVOL continues drifting lower despite BTC price consolidation.
The Deribit Volatility Index (DVOL) — which captures the average implied volatility across Bitcoin options — continues to hover near the low end of its recent range, sitting at 45%. This subdued level reflects a market in wait-and-see mode, hesitant to price in major moves as Bitcoin consolidates between $95,000 and $98,000.
Implied volatility last spiked in mid-January, aligning with Bitcoin’s all-time high at $109,000, when optimism about a new crypto-friendly U.S. administration peaked. Since then, however, DVOL has been on a downtrend, dampened by market disillusionment and a series of failed bullish follow-throughs. Interestingly, while DVOL has in last months shown negative correlation with BTC price, recent weeks have seen pockets of positive correlation, suggesting that traders are beginning to reprice upside scenarios — but with caution. For now, options markets appear to be waiting for Bitcoin to make its next decisive move before bidding up volatility again.
Skew Rebounds
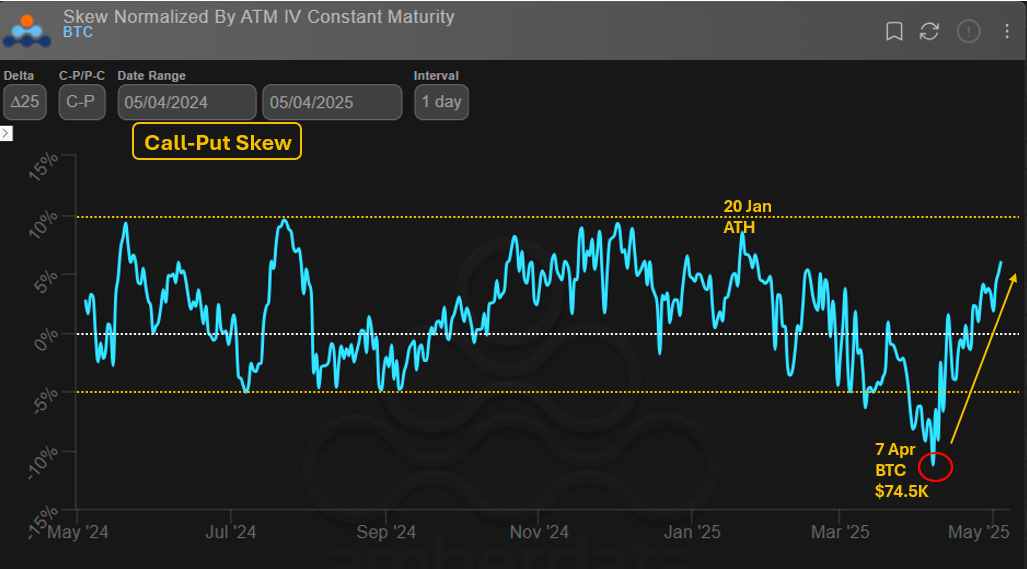
Skew rebounded above neutral after hitting –11% on 7 April; bullish sentiment cautiously returns.
The call-put skew chart above tracks the normalized IV difference between 25-delta calls and puts with a 30-day constant maturity. When the curve sits above the zero line, it signals higher implied volatility for calls, suggesting that traders are leaning bullish. Conversely, negative skew implies greater demand for downside protection.
On 20 January, when Bitcoin tagged its all-time high at ~$109,500, the skew stood near +10%, reflecting strong bullish sentiment. But that mood faded in the months that followed, ultimately bottoming out at –11% on 7 April, just as BTC touched $74,500. Since then, as the Bitcoin price headed upward, the skew has turned higher — and now sits back above the neutral line, indicating that bullish positioning is once again returning to the options market.
While the move is encouraging, it’s still early. The market appears cautiously optimistic, and it remains to be seen whether this skew trend will continue and support a broader shift in sentiment.
Recent Activities
Heatmap
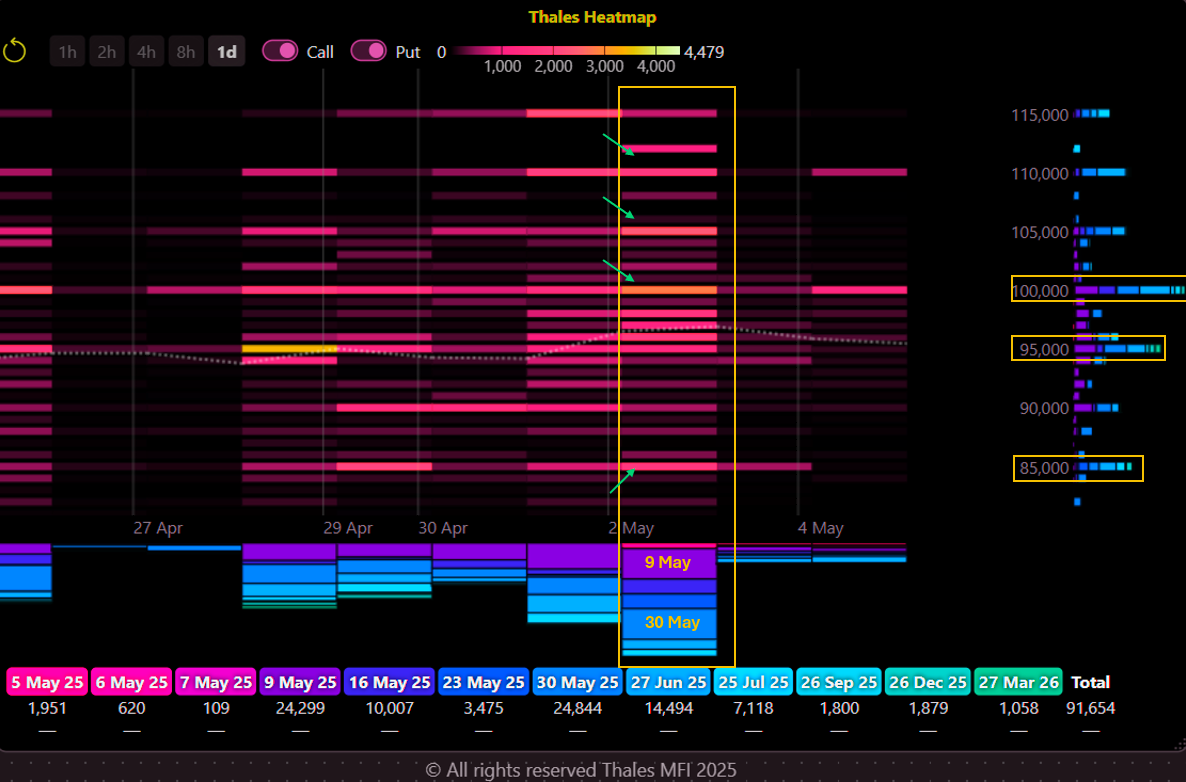
Post-expiry flows show bullish activity in short-dated calls near $95K–$100K for 9 & 30 May.
(OSS)
To capture recent flows at a glance, the Thales Heatmap offers a concise picture of where traders have been active. Following the expiry on 2 May, we see a surge in new positioning, particularly concentrated in call options at the $95,000, $100,000 and $110,000 strikes, and put interest around $85,000. These trades appear shortly after the maturity rolled off — a classic behavior as traders reset their books for the next leg.
What stands out in this round of activity is the heavy skew toward short-dated calls, primarily targeting the 9 May and 30 May expirations. The density and color intensity suggest meaningful size, hinting at renewed optimism for further upside through the month of May.
Market Screener
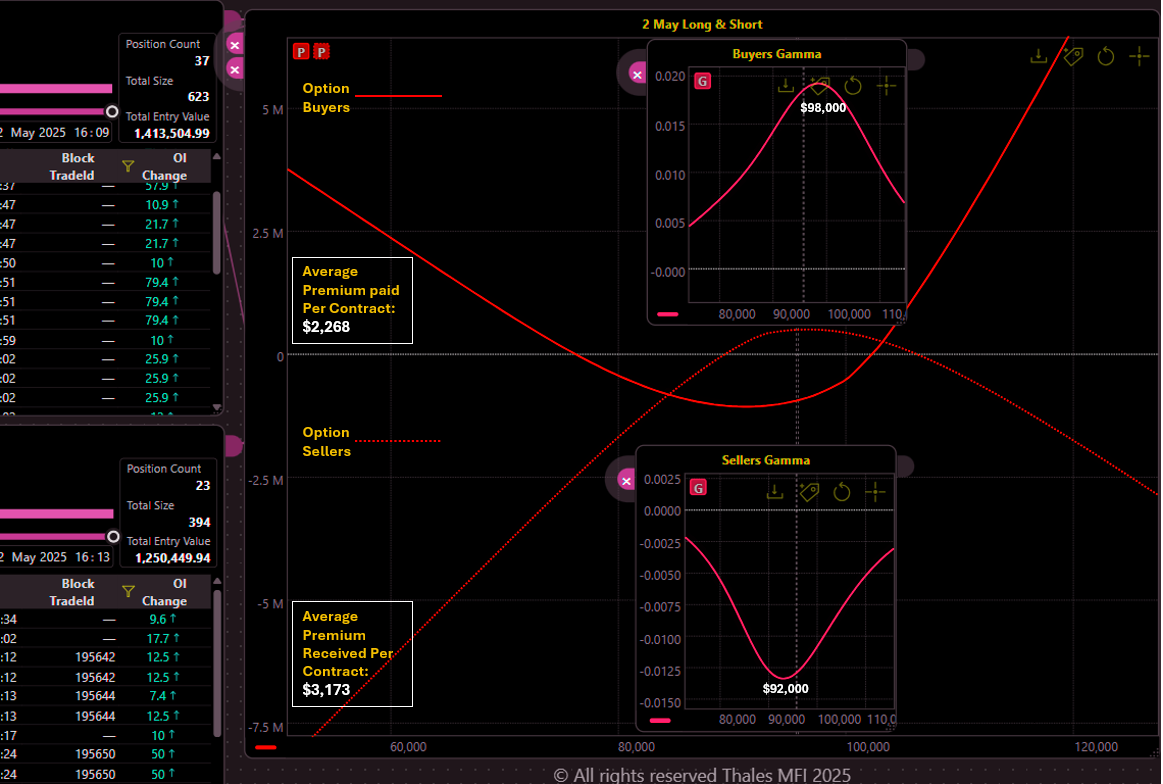
Buyers focused on $98K calls; sellers sold $92K puts. Net profile supports moderate bullish bias.
(OSS)
The Market Screener, filtered for trades entered on 2 May with expiries on 16 and 30 May, reveals a clear narrative: bullish bias through call buying and put selling. The net PnL profile — shown as the solid red line for buyers and the dotted line for sellers — illustrates how these strategies are distributed across strikes.
Option buyers focused their exposure near the $98,000 strike, as shown by the peak in their gamma profile, and paid an average premium of $2,268 per contract. Meanwhile, option sellers concentrated around the $92,000 level, collecting a more generous average of $3,173 per contract, primarily through selling puts.
This combination — calls bought above spot and puts sold below — reinforces what we saw in the Heatmap: expectations for further upside in May, but with sellers willing to step in and underwrite downside risk within a defined range. The structure suggests a measured bullish stance, supported by elevated premiums and directional positioning.
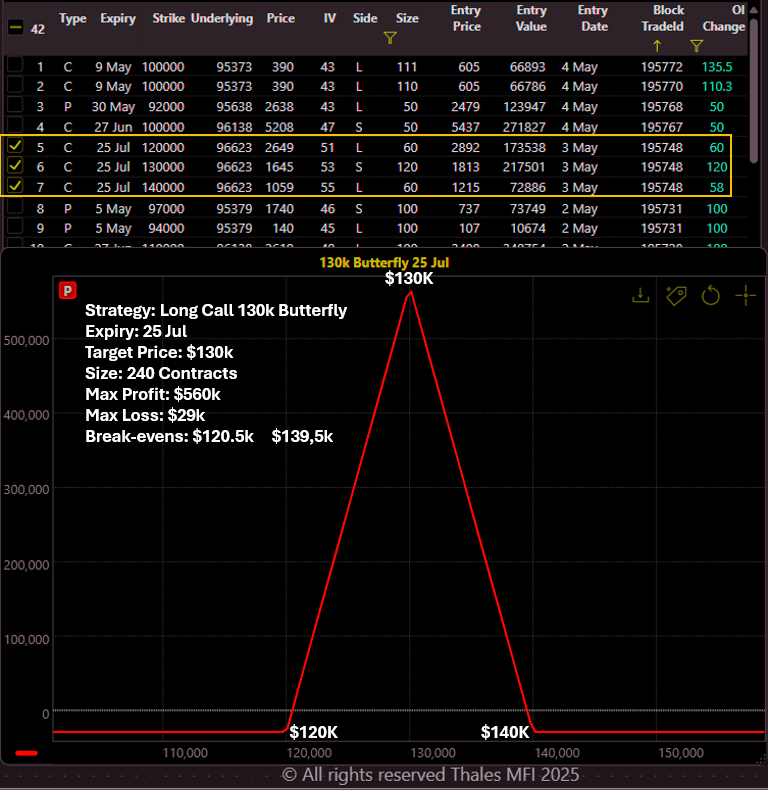
Strategy Spotlight – Long Call Butterfly Targets $130K
Low-cost butterfly for 25 Jul expiry targets $130K; $560K max profit vs $29K defined risk.
(OSS)
This week’s Strategy Spotlight highlights a Long Call Butterfly targeting the $130,000 strike for the 25 July expiry. The trade was recently spotted in the market and is composed of:
- Long 60x $120K Calls
- Short 120x $130K Calls
- Long 60x $140K Calls
This “pinning” strategy profits if Bitcoin lands close to $130,000 at expiry, where its payoff curve peaks. With a total position size of 240 contracts, the strategy offers a max profit potential of $560K — while the maximum loss is limited to just $29K, a relatively modest amount given the scale.
Despite the attractive reward-to-risk ratio, it's important to note that landing exactly at $130K is far from guaranteed. However, the break-even range from $120.5K to $139.5K provides some flexibility for a partial win. This is a low-cost, high-target idea, and its presence suggests that some traders are speculating on a grind higher through the summer, with the $130K level acting as a key technical or psychological magnet.
Bottom Line
The 2 May expiry may have passed without fireworks, but under the surface, the Bitcoin options market is actively reloading. While implied volatility remains low, both skew and positioning hint at a subtle but growing bullish bias. Traders are leaning into upside structures, with short-term call flows dominating recent activity and summer expiries attracting more directional bets. Whether these positions pay off will depend on how decisively Bitcoin breaks from its current range — especially around the $95K–$98K zone, where gamma pressure and open interest converge. For now, the market waits — but it's certainly not asleep.
Disclaimer
This Outlook is provided for informational and educational purposes only and does not constitute financial, trading, or investment advice. All market analysis reflects current observations and does not guarantee future outcomes. Options trading involves significant risk and may not be suitable for all investors. Please consult a qualified financial advisor before making any investment decisions.