Introduction
Bitcoin has once again defied gravity, settling its third consecutive Friday expiry above the max pain level. Yet, beneath the calm surface of price stability, the options market is quietly positioning for turbulence. In this week’s Outlook, we dissect these nuanced signals—where overt bullish momentum meets an undercurrent of growing caution.
While open interest and notional volumes remain robust, implied volatility has collapsed to its lowest level in over a year, creating a tension-filled backdrop. Traders appear caught between waiting for the next catalyst and preparing for a potential correction, as evidenced by an unusual surge in put activity for the upcoming 23 May expiry. Even more telling is the market’s silent focus on the $80,000 strike across multiple maturities—raising subtle warning flags without outright panic.
In this edition, we explore these contradictions in full. From the structural positioning across all expiries to the recent calm in dealer gamma exposures, from the frustrating environment for premium sellers to the strategic plays of market professionals—every datapoint contributes to a complex but highly readable map of market sentiment.
Whether you are seeking tactical insights or broader market direction, this week’s analysis will help you understand where the market stands—and where it might be headed next.
Explore these market dynamics firsthand with the Thales Options Strategy Simulator (OSS)
Market Snapshot
Expiry Recap – 16 May 2025
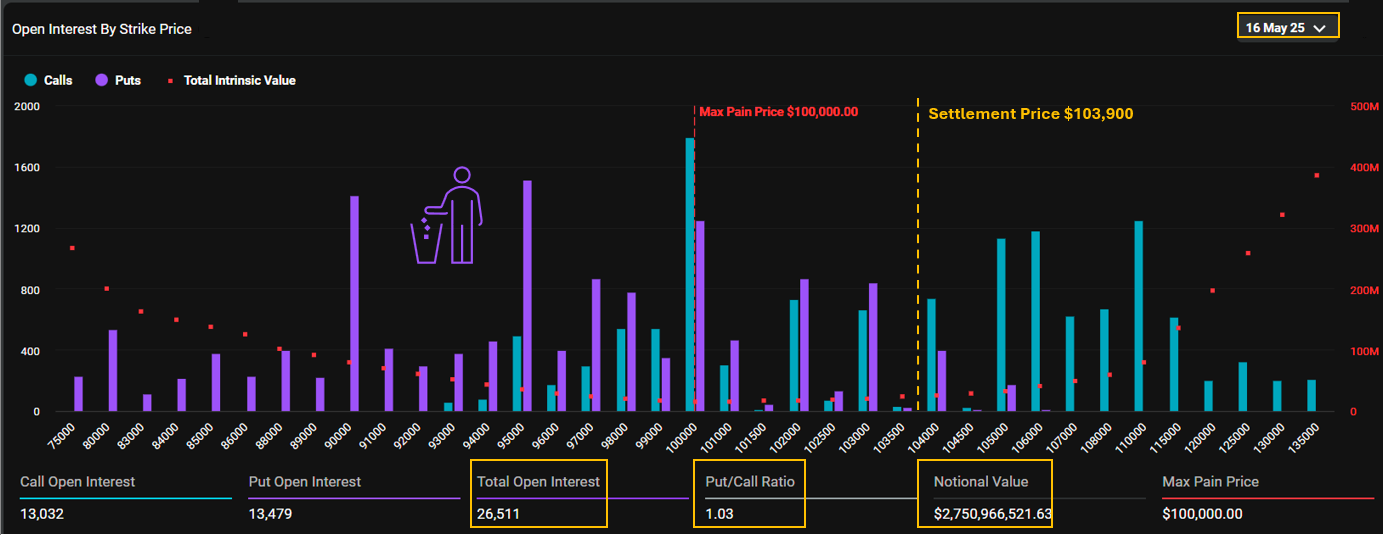
Bitcoin settled at $103.9K, above max pain of $100K. Puts expired worthless despite a high put/call ratio.
Bitcoin’s 16 May options expiry closed at $103,900 — slightly above the $100,000 max pain level. With 26,500 open contracts and $2.75 billion in notional value, this weekly expiry marks the third consecutive Friday settlement above max pain. While the price remained close to last week’s closing zone, the outcome once again favored call holders.
In particular, the $100,000 strike — home to the largest call open interest — finished in the money, along with the strikes below it. In contrast, most puts with substantial open interest expired worthless. This dynamic unfolded despite a put/call ratio above 1.0, indicating a market still hedging actively and reflecting trader hesitation near key psychological levels.
Structural Outlook: Positioning Without the Noise
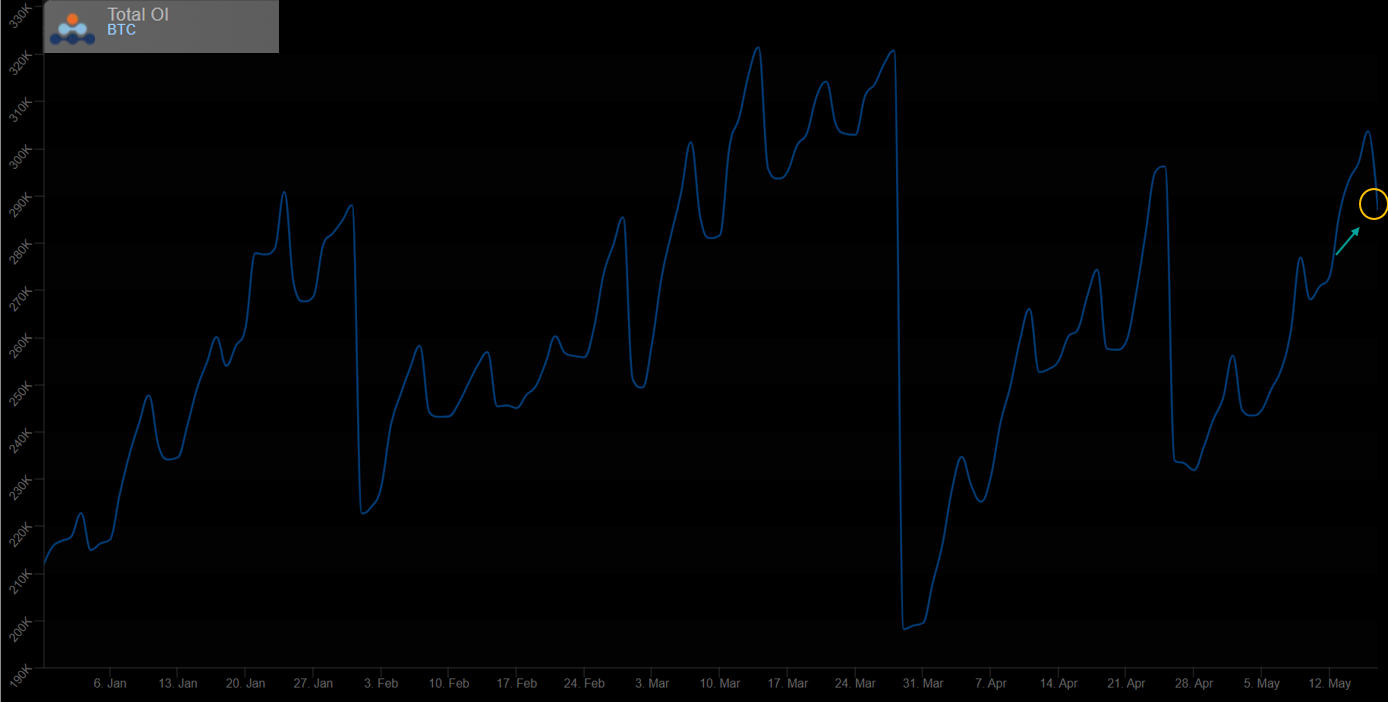
Open interest has steadily rebuilt post-expiry, signaling renewed engagement and healthy participation across the Bitcoin options mark.
Stepping back for a broader perspective, the full-term open interest distribution on Deribit offers a clearer signal through the market’s structural noise.
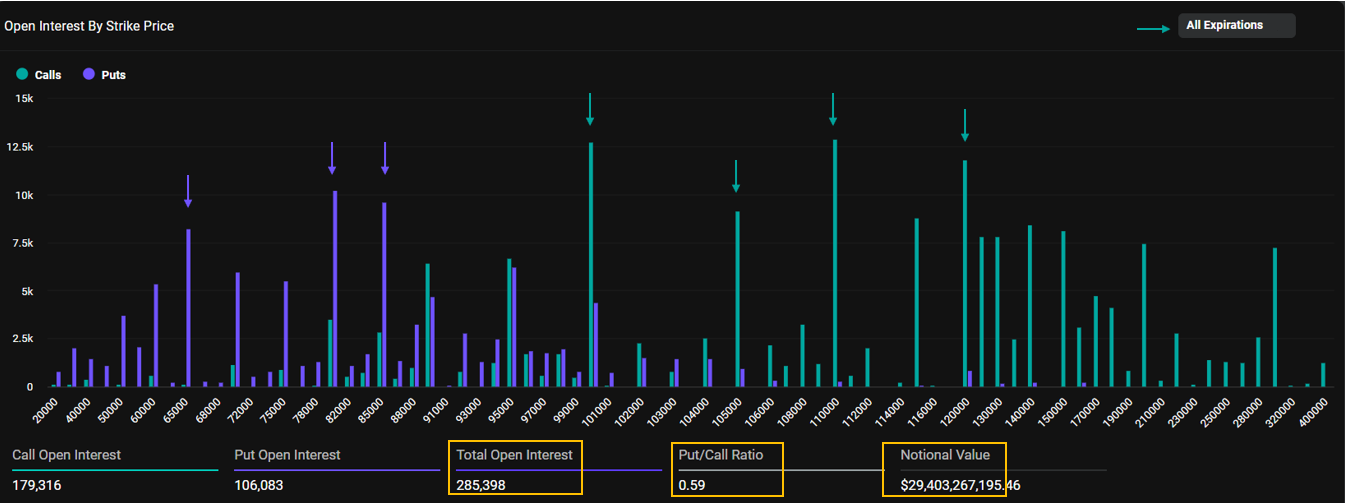
A balanced market structure with $30B notional value. Calls dominate key resistance zones; puts act as downside hedges.
With over 285,000 open contracts and a notional value approaching $30 billion, the Bitcoin options market remains deep and active. The put/call ratio stands at a neutral 0.59, reflecting a typical risk posture rather than extreme sentiment.
On the call side, open interest is notably concentrated at $100K, $105K, $110K, and $120K — reinforcing the market’s ongoing focus on key round-number resistance zones. Meanwhile, open interest in puts is heaviest at $85K, $80K, and $65K, suggesting prudent hedging activity by investors managing downside risk exposures. The result is a market leaning bullish, but not without contingency planning.
Caution on the Horizon: Unusual Weight Behind 23 May Puts
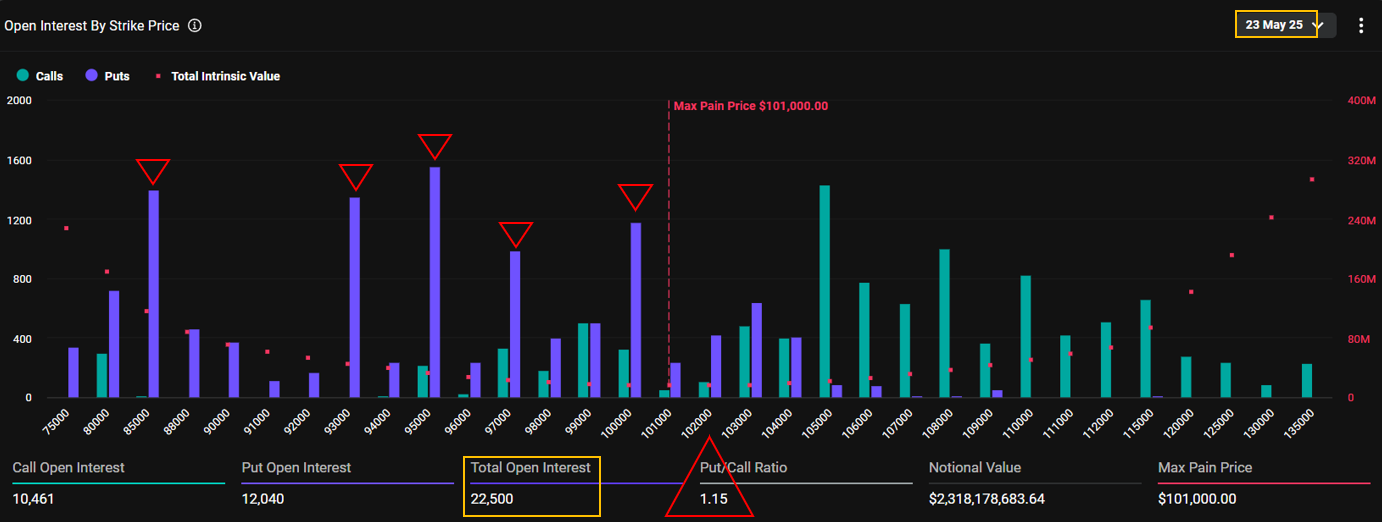
Put dominance emerges with a record-high put/call ratio of 1.15, signaling caution ahead of next Friday’s expiry.
Looking ahead to the 23 May expiry, the positioning speaks for itself. Puts clearly dominate the board, with a record-high Put/Call ratio of 1.15 — the highest in recent memory — underscoring a market bracing for downside. This stands in contrast to recent bullish outcomes, where the last three Friday expiries saw most puts expire worthless.
While the clustering around $100K and $97K might be interpreted as tactical hedges or short-term directional bets, the significant open interest at far out-of-the-money strikes like $93K and even $85K raises eyebrows. These contracts, listed only since early May, suggest either highly speculative positions or components of more complex structures.
Regardless of the intent, the message is clear: a segment of the market is increasingly concerned about a potential pullback. Whether this caution proves warranted — or these puts join the recent string of futile hedges — remains to be seen.
IV Compression: Calm Before the Storm?
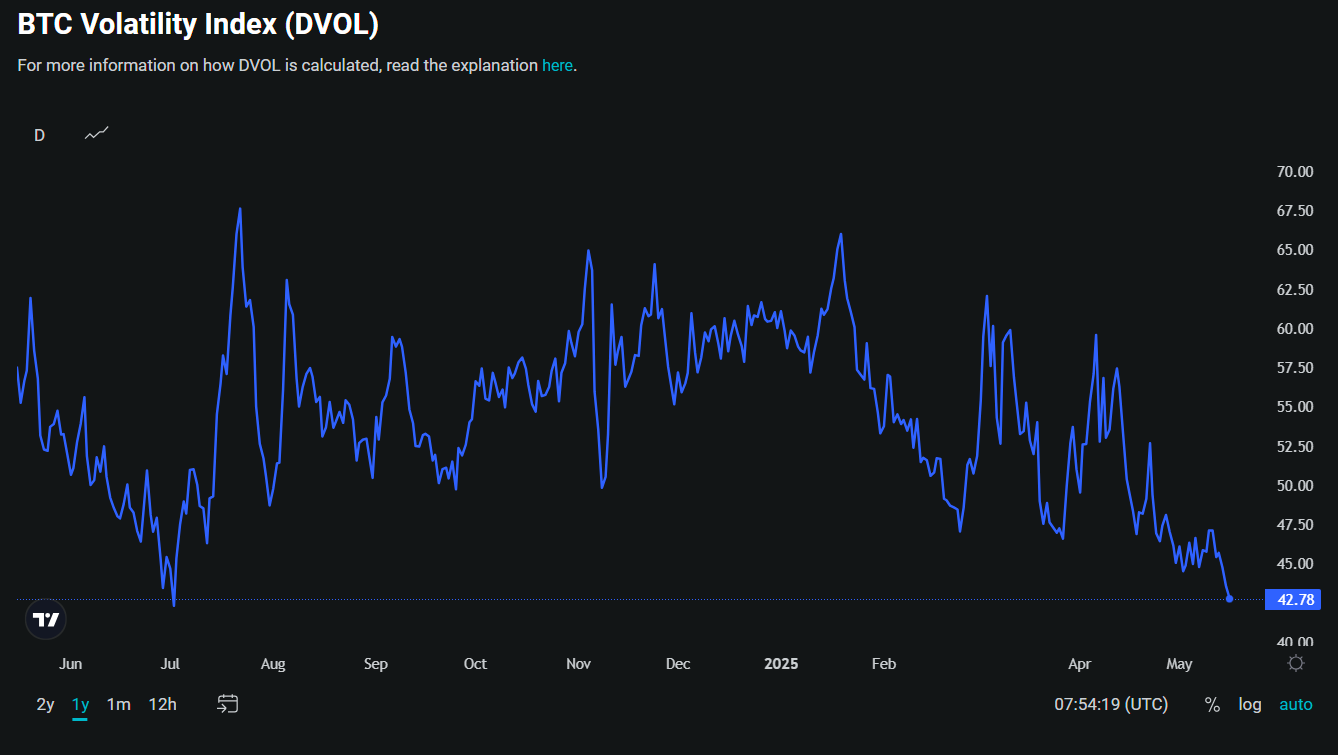
DVOL drops to 42.7%, its lowest level in over a year, signaling suppressed implied volatility and market indecision.
Bitcoin's implied volatility continues to drift lower, with the Deribit Volatility Index (DVOL) now sitting at just 42.7% — almost its lowest reading in over a year. This prolonged suppression of IV suggests a market waiting for a catalyst, a spark to reawaken activity and push the blood pressure of options market back toward its healthy range above 60%.
Such an environment often signals a kind of collective breath-holding. Traders aren't rushing to price in dramatic moves — at least not yet. But that doesn’t mean the options market is inactive. Quite the opposite: low-IV periods can offer clarity. With noise reduced, positioning becomes more deliberate, and strategy more revealing.
For long-dated option buyers, this is a window of opportunity — volatility is cheap, and directional plays have attractive profiles. But for theta sellers, the dry, motionless landscape is increasingly unforgiving, making yield harder to extract without taking on excessive risk.
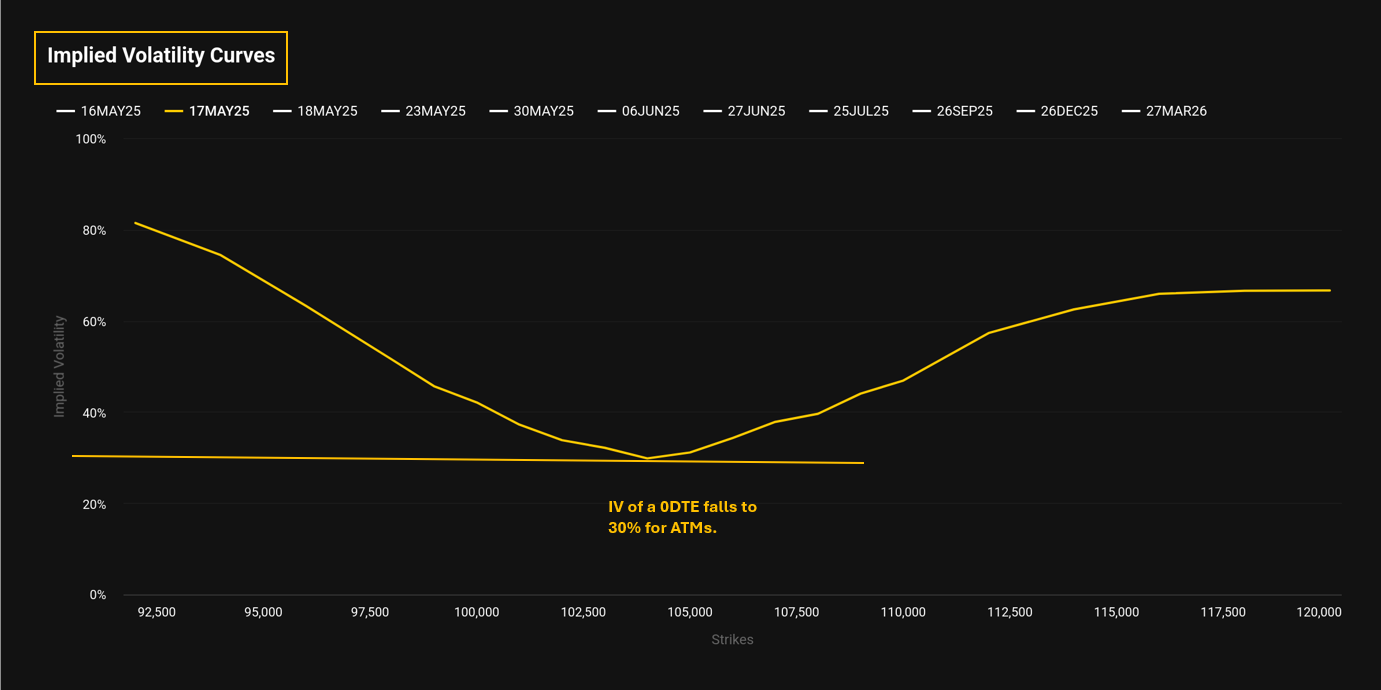
Implied volatility collapses to 30% for at-the-money options, frustrating short-term premium sellers.
For premium collectors, the current environment borders on exasperating. As shown in the IV curve above, the implied volatility for 0DTE (zero days to expiry) options has collapsed — reaching as low as 30% for at-the-money strikes. This level of compression not only limits premium potential but also demands a far more precise approach for short-vol traders.
With so little juice left in the front-end curve, many option writers are left hesitant, if not sidelined altogether. It’s a market condition that punishes overextension and rewards patience — or tempts a shift toward longer-dated exposures where implied vol remains marginally more supportive (see the chart below).
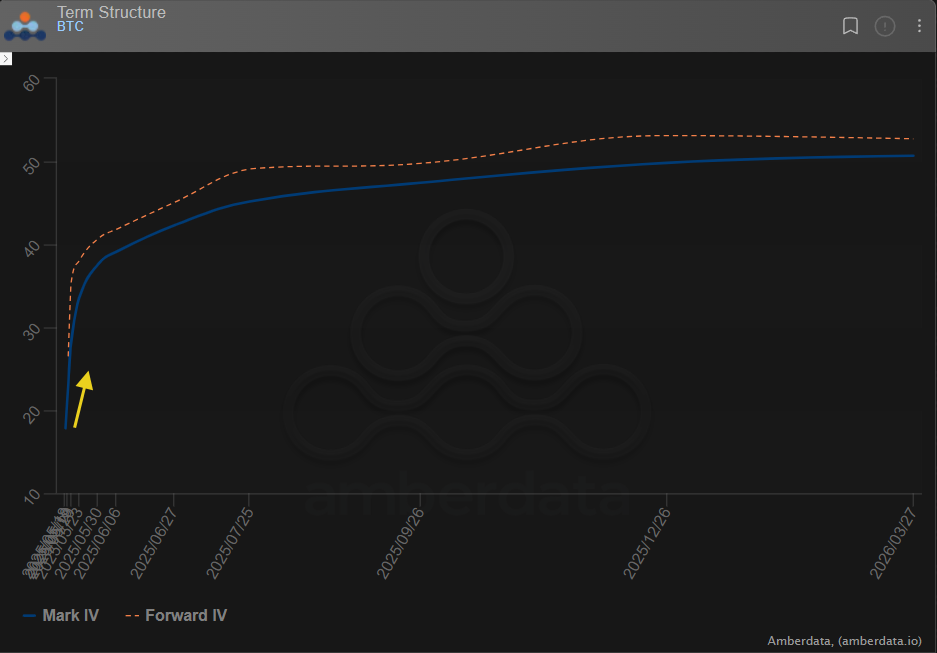
Short-term IV remains heavily compressed, while longer-dated expiries offer relatively higher volatility.
Risk of Gamma Is Low for Dealers
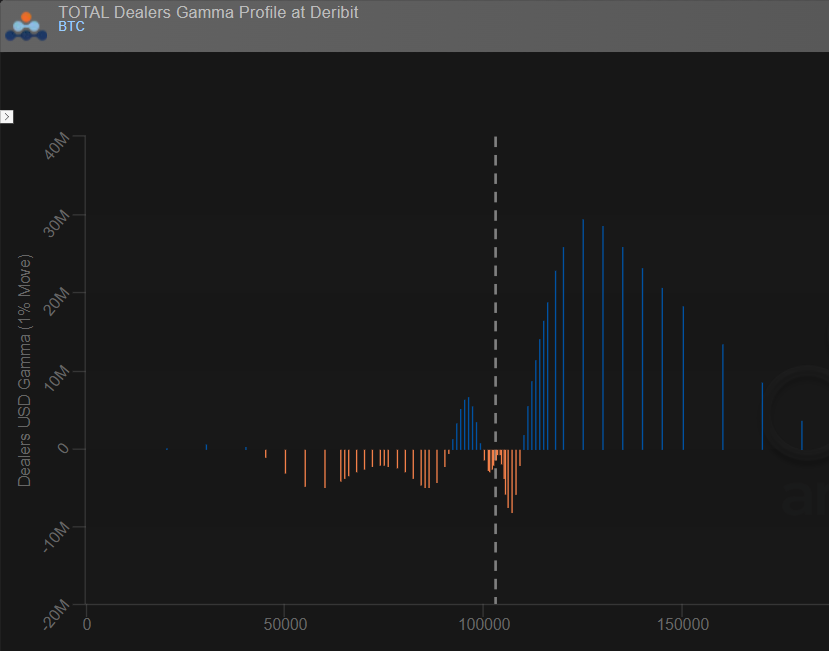
Gamma risk remains low and evenly distributed. Dealers face minimal forced hedging near the $100K spot price.
In terms of gamma exposure, the current setup appears benign for option dealers. As the chart above illustrates, Deribit’s gamma profile shows no extreme concentrations around any critical price level. The exposure is well-distributed and modest, especially near the current spot around $100K.
This indicates that dealers are not caught in aggressive hedging loops, nor are they forced into major directional trades to stay delta neutral. With gamma risk low, price moves are less likely to be exacerbated by dealer hedging flows — reducing the chance of sharp, feedback-driven swings in the immediate term.
Recent Activities
Thales Heatmap: A Quiet Market with a Subtle Warning Signal
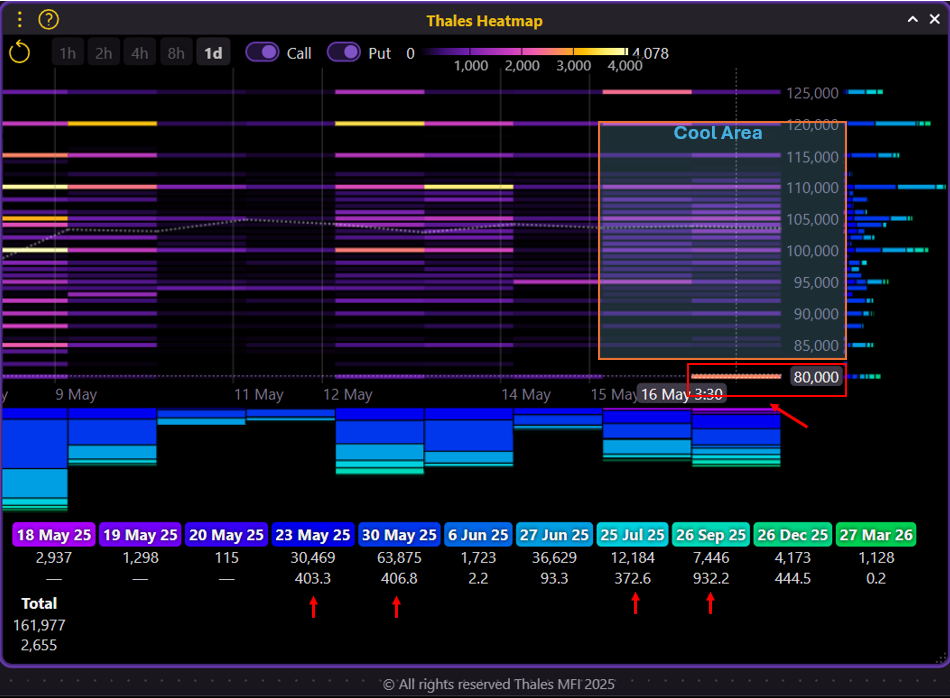
Normal market activity with one exception: notable downside positioning at the $80K strike across multiple expiries.
(OSS)
The Thales Heatmap shows no unusual hotspots in the past few days, suggesting normal market activity and healthy trading flows. Most of the positioning remains balanced without any significant spikes in activity across key strikes.
However, one notable development stands out — a sudden and relatively large concentration of trades around the $80,000 strike. What makes this more interesting is the variety of expiries involved, ranging from 23 May all the way to 26 September and even 26 December.
While it’s premature to assign a definitive narrative to this activity, it’s a signal worth monitoring. Whether it reflects prudent hedging, complex portfolio structures, or a growing concern for downside protection, this strike has quietly become a focal point for defensive positioning.
Market Screener
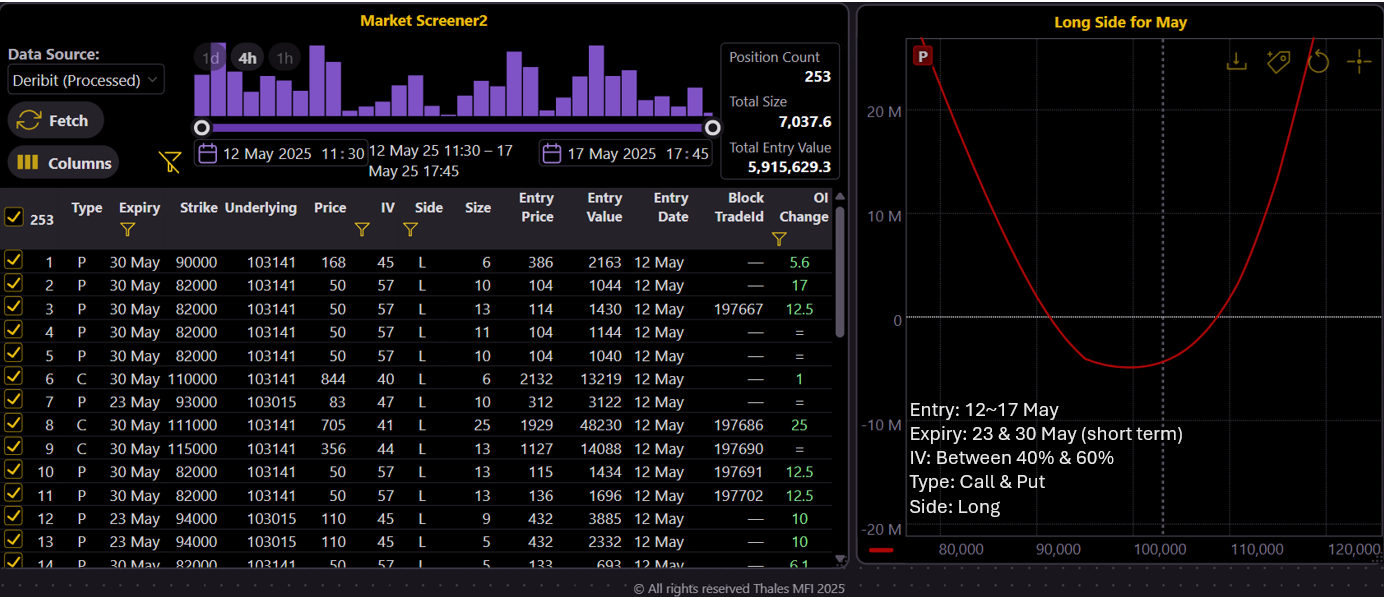
Recent buying activity forms a long strangle-like profile, with breakevens near $91K and $108K, reflecting cautious positioning.
(OSS)
To pinpoint directional tendencies in recent activity, we turn to the Thales Market Screener. We filtered trades executed between 12–17 May, focusing on the long side (buyers only), near-term expiries (23 & 30 May), and options priced within an implied volatility range of 40–60%.
The resulting profile closely mirrors a long strangle, with breakeven points around $91,000 and $108,000.
Strategy Spotlight – A Bear Put Ratio Spread for 23 May
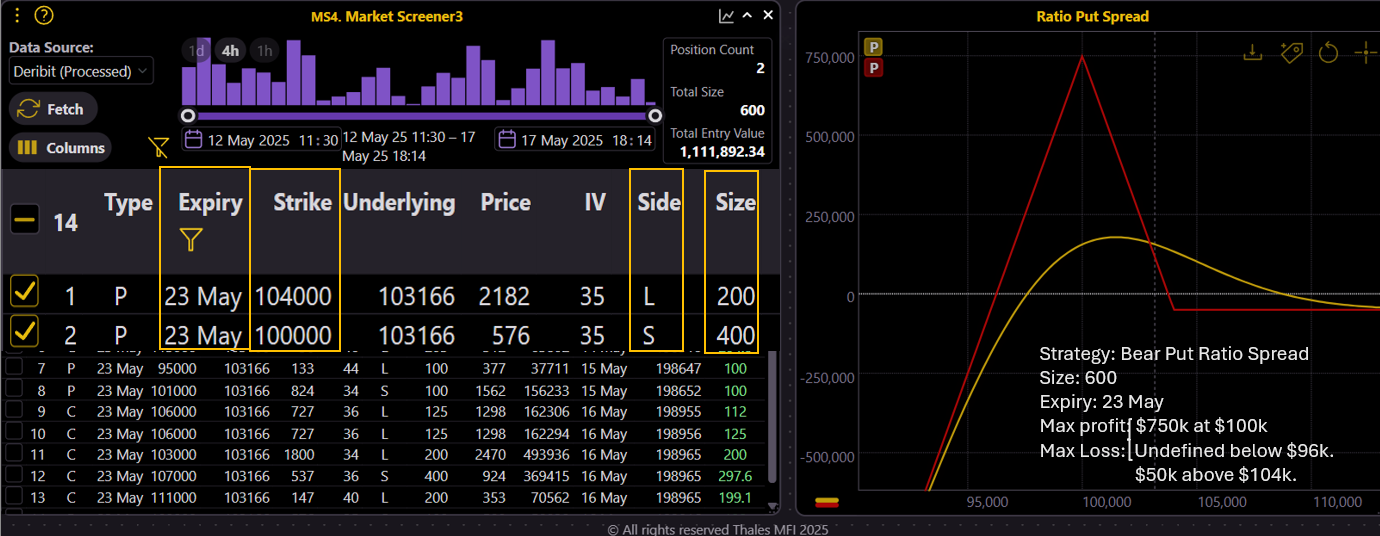
A 600 BTC bear put ratio spread for 23 May aims for a $750K max profit at $100K, but faces unlimited downside below $96K.
(OSS)
This week’s editor’s choice brings a tactically structured Bear Put Ratio Spread into the spotlight — a smart, asymmetric play deployed with a total size of 600 BTC for the 23 May expiry.
The trader entered a two-leg block combo: buying 200 contracts of 104K puts (in-the-money), and simultaneously selling 400 contracts of 100K puts. The right side of the payoff curve reveals a defined risk of $50K if Bitcoin expires above $104K, and an attractive maximum profit of $750K if the price lands right at $100K — the sweet spot.
However, this clever construct comes with a caveat: losses become unlimited if Bitcoin falls below $96K. Either the trader has high conviction that such a drop won't materialize, or a mitigation plan (e.g., delta hedging) is ready.
Overall, this is a moderately bearish setup, betting on a controlled retracement toward $100K. It aligns with other signs we’ve explored, suggesting short-term correction expectations without an all-out bearish stance.
Bottom Line
The Bitcoin options market remains calm on the surface, with low implied volatility and muted dealer risk. But beneath that calm, signs of caution are building — especially in short-term put positioning for the 23 May expiry and unusual activity around the $80K strike. While recent expiries favored calls and the broader structure leans modestly bullish, the market appears to be bracing for a short-term pullback.
Disclaimer
This Outlook is provided for informational purposes only and does not constitute financial advice or investment recommendations. The analysis reflects current market observations and should not be interpreted as a solicitation to buy or sell any financial instruments. Trading in digital assets and derivatives involves substantial risk, and you should carefully assess your financial situation and consult a professional advisor before making any trading decisions.