Introduction
As Bitcoin breached $112,000 to print a new all-time high, the mood in the options market revealed a far more nuanced picture. While price action charged ahead, the volatility surface stayed subdued, and traders showed signs of hesitation beneath the surface optimism.
In this week’s Outlook, we explore the fascinating divergence between directional strength and implied volatility fatigue. From the fourth consecutive weekly expiry above max pain to rising interest around the $115K strike for early June, signals are emerging that point to both continuation and caution. A striking number of straddle-like formations suggest a market unwilling to lean too hard in either direction. Even at elevated price levels, positioning remains hedged and tactical.
As structural flows concentrate around the 30 May and 6 June expiries—and heatmap data shows short bursts of euphoria fading into measured trading—we take a deep dive into what these formations really mean. Are traders simply being prudent, or is the market bracing for something more?
We analyze gamma exposure, volatility regimes, and key strategies like the $115K Butterfly to draw out the most relevant signals for what lies ahead.
Explore these market dynamics firsthand with the Thales Options Strategy Simulator (OSS)
Market Snapshot
Expiry Recap – 23 May 2025
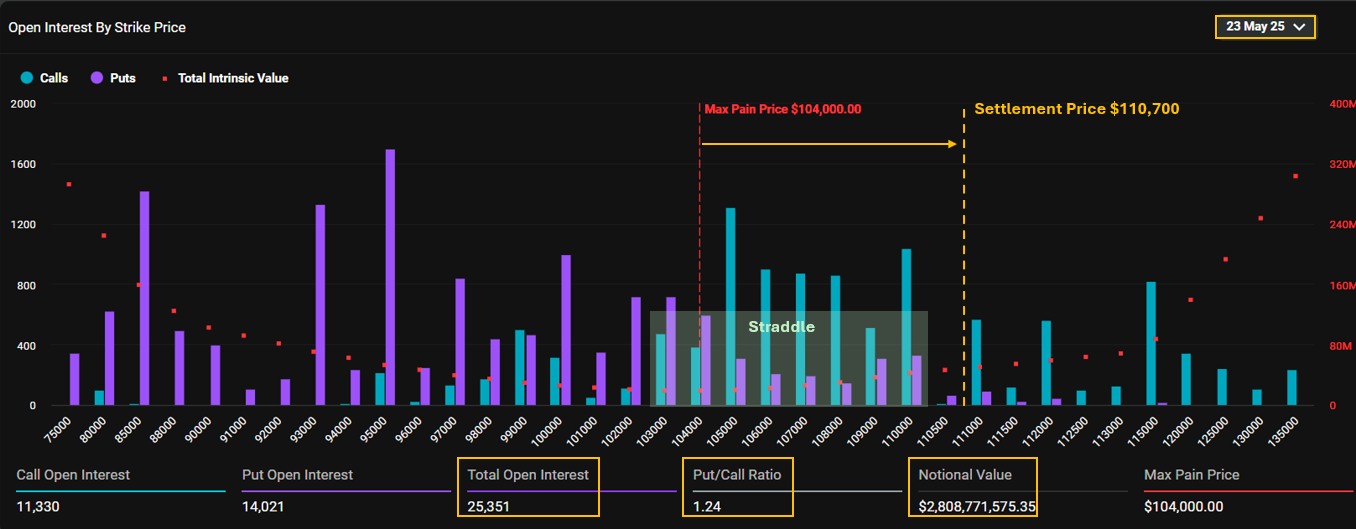
Calls up to $110K expired ITM, while puts at $95K and $85K expired worthless for a fourth week in a row.
Bitcoin’s 23 May options expiry settled at $110,700 — significantly above the $104,000 max pain level. This marks the fourth consecutive Friday in May where expiry closed above max pain, underscoring the recent dominance of bullish momentum.
With 25,000 open contracts and a notional value of $2.8 billion, this was a typical weekly expiry in terms of scale. Yet the implications were far from routine. Calls with strikes at or below $110,000 — especially the $105K cluster — expired in the money, delivering solid payoffs for their early buyers. Meanwhile, most puts, including the once-active $95K and $85K strikes, expired worthless once again.
An interesting pattern emerged as we examined the strikes between $103K and $110K. Here, a series of overlapping call and put positions suggest the presence of straddles — a strategy that thrives in volatility. Traders seemingly lacked confidence in a stable price around this zone and hedged both directions. However, as Bitcoin pushed higher, the rising dominance of calls revealed a directional conviction. The green call bars tapering off at the $110K strike indicate traders’ cautious stance around this resistance, at least in the short term.
Structural Outlook – 30 May 2025 Expiry
Straddle-like structure from $95K to $111K suggests caution.
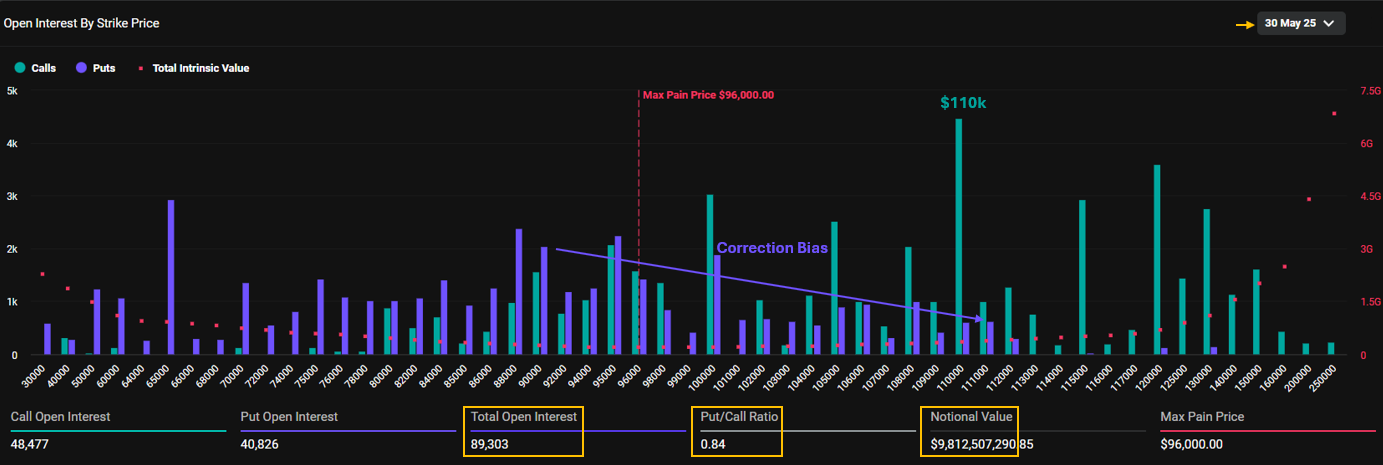
The upcoming 30 May expiry stands out as a critical milestone on the Bitcoin options calendar. With over 89,000 open contracts and $9.8 billion in notional value, it is the second-largest maturity after 27 June.
As a monthly expiry listed since late February, its positioning offers deeper structural insights beyond short-term volatility.
The max pain level is marked at $96,000, yet a wide range of call strikes are already in-the-money — including $100K, $105K, and probably, $108K. Notably, the $110K strike looms large with more than 4,500 call contracts and now sits at-the-money. Above that, call interest stretches as far as $150K, showcasing the high-end ambitions of some bulls. On the opposite end, the distant $65K put strike — a relic of earlier bearish sentiment — lingers as a reminder of how far the market has come.
From a shorter-term perspective, the structure exhibits a straddle-like pattern, with near-equal put and call interest stacked between $95K and $111K. This “shoulder-to-shoulder” formation suggests hesitation. (see the image below.)
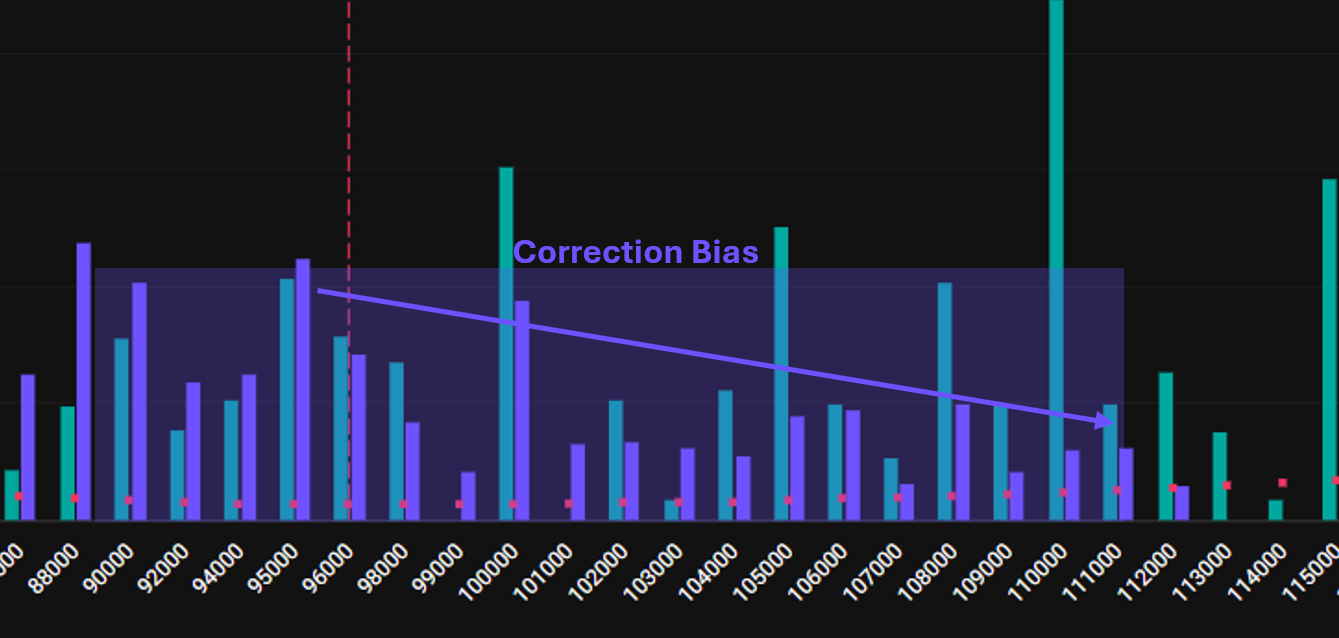
Balanced call/put interest between $95K–$111K highlights hesitation, with puts chasing the rally for a potential correction.
Rather than displaying outright bullish conviction, the market appears cautious — with puts chasing the rally, awaiting a correction. The defensive stance likely emerged as soon as Bitcoin breached the $98K resistance, prompting traders to hedge against a reversal.
So far, that caution remains unrewarded. But the positioning underscores an important message: while the rally has held firm, confidence in its sustainability is not absolute. The market continues to prepare for a pause — or a pullback — even as price action tests new highs.
Gamma Exposure – 6 June 2025: Where Speculators Are Looking
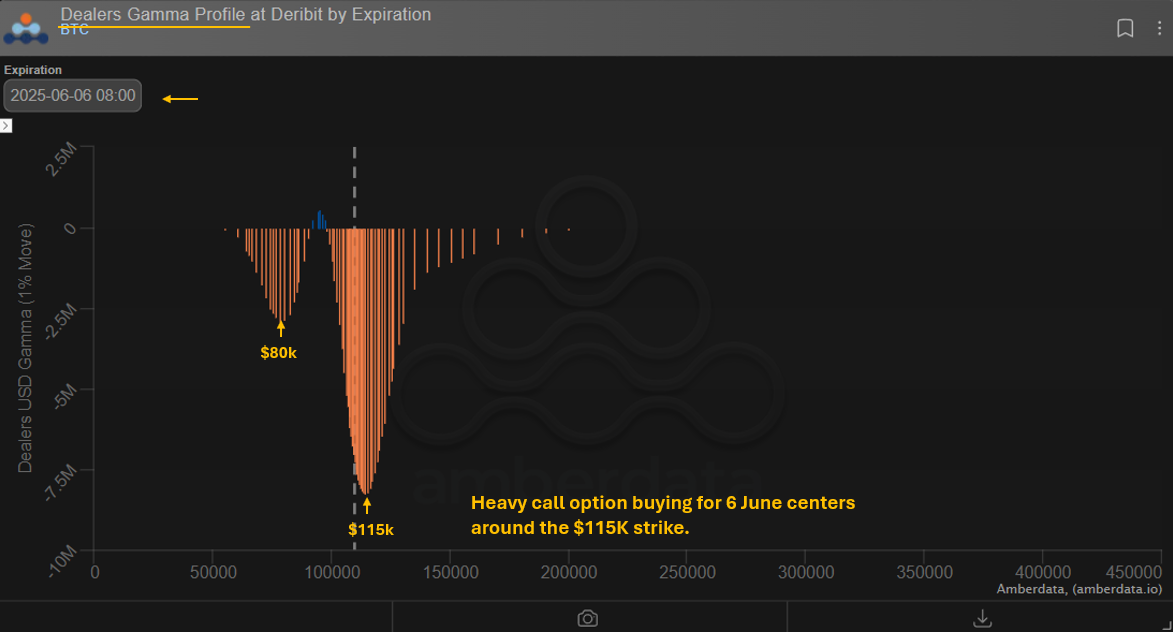
Dealers hold large negative gamma at $115K, indicating concentrated speculative call buying.
As noted earlier, the 30 May expiry is a long-standing monthly contract with layered positioning. To isolate the more immediate sentiment of option traders, we shift our focus one week forward to the 6 June expiry. The Dealers Gamma Profile chart above provides a clear view of where dealers are most exposed—essentially, where they have sold the most options and now hold significant negative gamma.
The chart shows a pronounced spike in negative gamma at the $115K strike, indicating heavy speculative call buying at that level. A secondary cluster appears near $80K, but the magnitude at $115K stands out. In practical terms, this means a significant share of traders are targeting $115K as a near-term upside objective. If price accelerates toward that region, dealer hedging flows could amplify volatility.
This aggressive positioning tells us that speculative appetite is not only alive but concentrated—and that certain traders are expecting momentum to continue beyond the recent ATH. The question remains: has this optimism impacted implied volatility? We explore that next.
Implied Volatility – A Market Unmoved by ATH
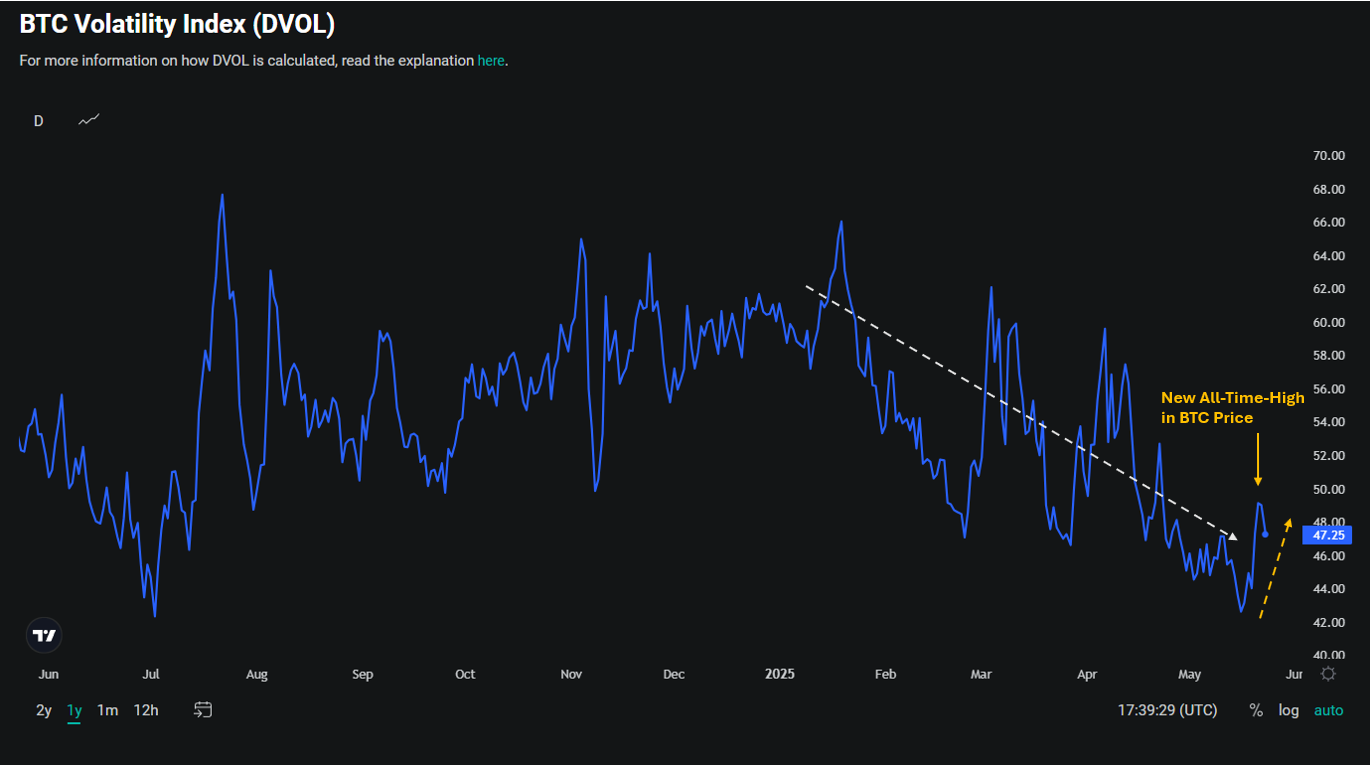
Despite new ATH at $112K, DVOL remains under 50%, highlighting structural suppression in IV.
Despite Bitcoin printing a new all-time high at $112K on May 22, the options market remains remarkably composed. The Deribit Volatility Index (DVOL), which reflects the implied volatility priced into BTC options, barely reacted — lifting briefly from its one-year low near 42%, but failing to hold even the 50% mark.
This underwhelming response stands in stark contrast to the typical surge in IV that usually accompanies fresh highs. The muted behavior may reflect more than just a calm surface. It could signal a structural shift in how the Bitcoin options market operates. Increasingly, traditional market participants — institutions and professional volatility sellers — are becoming active players. Their presence often exerts downward pressure on implied volatility, as they monetize premiums and systematically dampen the volatility surface.
What we’re witnessing may be the early days of a new volatility regime in Bitcoin market. The days of 60–70% IV as a baseline could be behind us. If so, traders will need to adjust expectations and strategies — pricing in not just directional outcomes, but a more mature volatility landscape where option premium is harder to come by, and spikes are shorter-lived.
Recent Activities
Heatmap – Recent Activities: A Burst of Euphoria Followed by a Cooling Phase
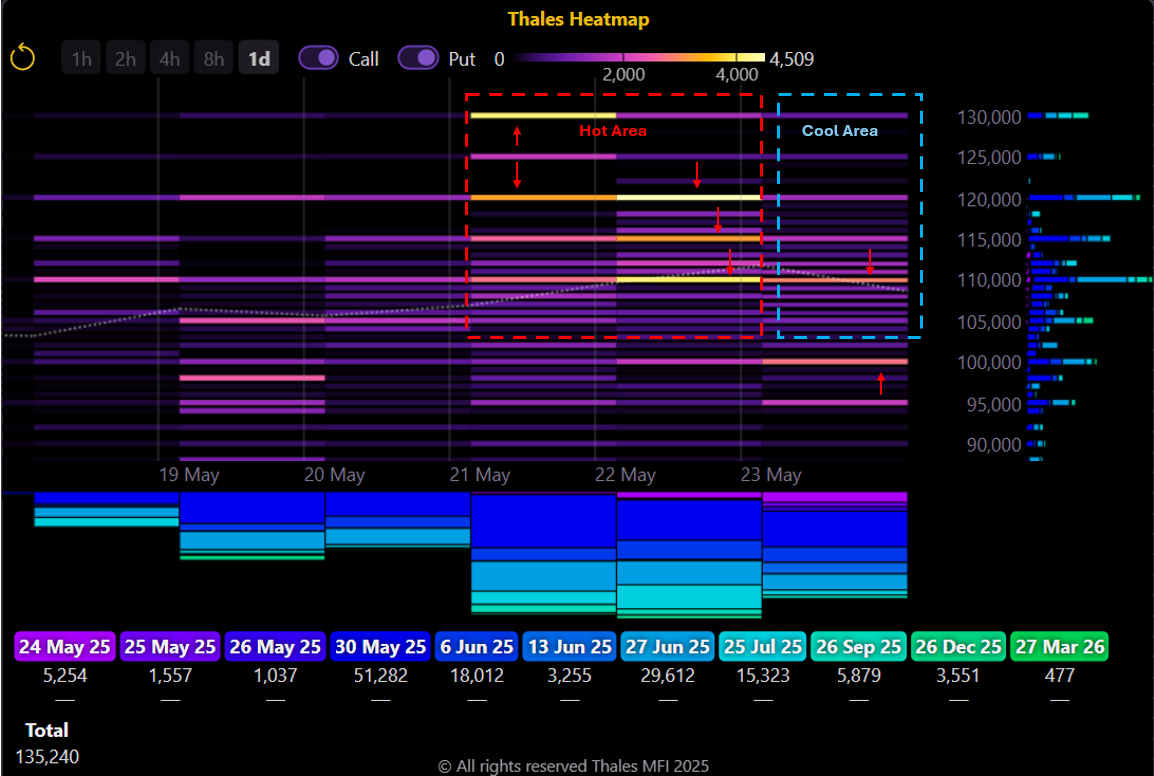
Bullish activity peaked on 22 May across 110K–130K strikes, but cooled by 23 May as price momentum faded.
(OSS)
To capture the most recent positioning trends in the Bitcoin options market, we turn to the Thales Heatmap. As the chart illustrates, activity surged dramatically on 22 May—just as BTC was pushing toward a new all-time high. A clear “hot zone” emerges above spot, centered around the 110K, 115K, 120K, and even 130K strikes.
However, by 23 May, the mood had shifted. The market cooled noticeably, and activity retreated to more conservative levels, with the 100K strike emerging as the most traded zone.
The expiration timeline color code at the bottom of the heatmap shows that most of this recent flow concentrated on the 30 May and 27 June maturities—both highly liquid expiries. The persistence of interest in strikes like 110K and 120K underscores that upside bets haven’t vanished; they’ve just tempered.
Market Screener – Balanced Buying, Hesitant Outlook
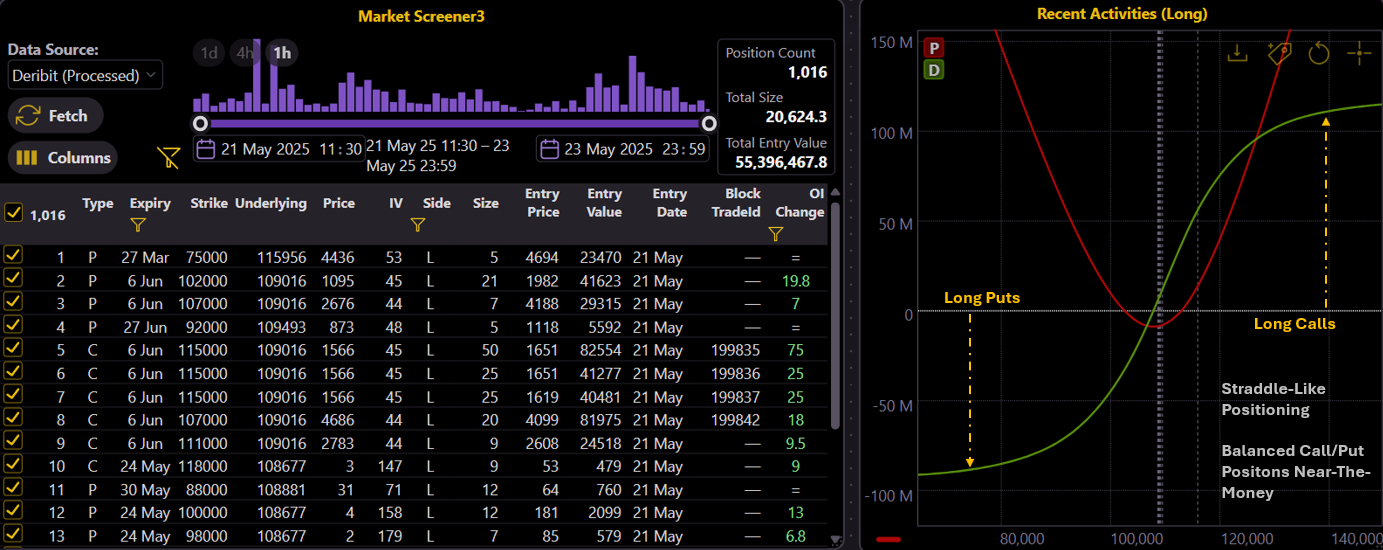
Recent trades show balanced long calls and puts, reinforcing the market’s cautious and hedged stance.
(OSS)
To further refine our understanding of recent positioning, we turn to the Thales Market Screener. We’ve filtered the data for long-side entries placed between 21–23 May, with a focus on June and July expiries. The resulting profile, visualized in the strategy payoff curve, reveals a remarkably balanced structure—calls and puts purchased in nearly equal measure across a wide range of strikes.
This composition mirrors the shoulder-to-shoulder straddle-like formations noted earlier in the open interest data. Traders are clearly active, and directional interest remains alive, but they appear unwilling to commit fully to a one-sided view.
Instead, what emerges is a tone of guarded optimism. The market has cleared several major resistance levels, and momentum has pointed upward. Yet, traders continue to hedge actively—pairing long calls with protective puts. The message? Expectation, tempered by prudence. In the current environment, optionality is favored over conviction.
Strategy Spotlight
Butterfly Precision: $115K Target for June 13
A low-cost directional play targeting $115K, with $700K max profit and $96K max loss at expiry.
(OSS)
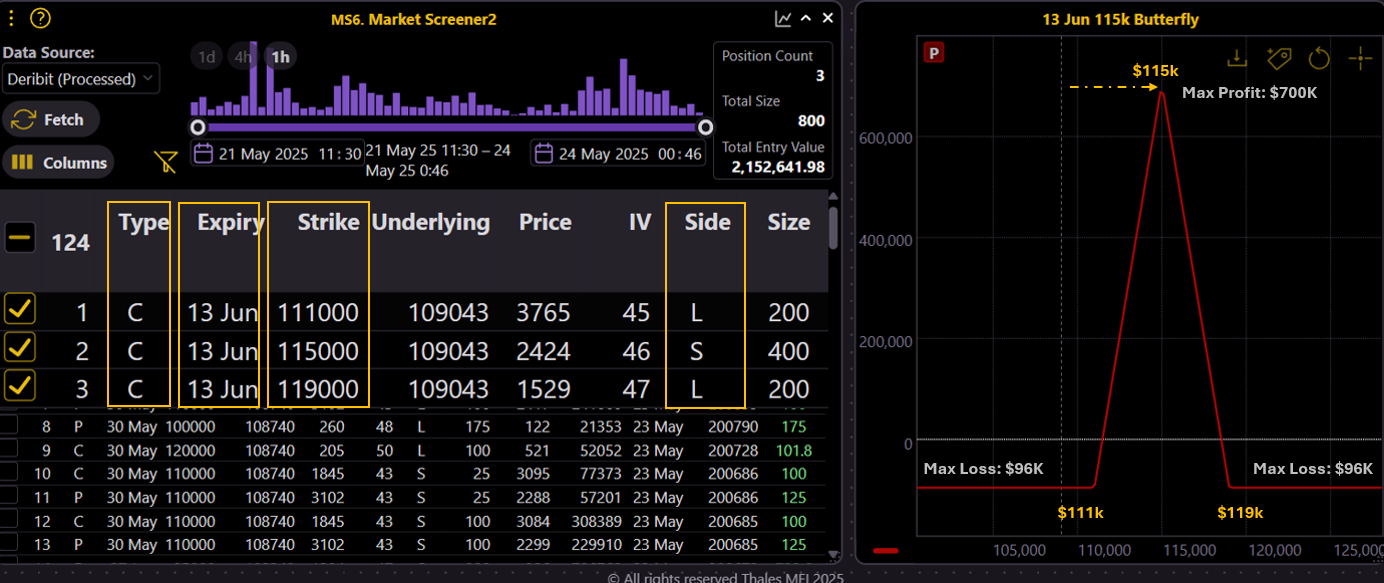
No Outlook is complete without a spotlight—and this week, we’ve captured a noteworthy short-term structure: a Call Butterfly Spread with a sizable 800 BTC, entered as a block trade on 23 May.
This three-leg structure consists of:
- 200 long calls at $111K
- 400 short calls at $115K
- 200 long calls at $119K
Set to expire on 13 June, the strategy targets $115K as the ideal settlement level. If Bitcoin lands precisely on target, the trader stands to gain $700K in profit. The profit zone spans between approximately $113.5K and $116.5K, while losses are capped at $96K outside of those bounds.
Butterflies are a favorite for good reason—minimal cost, clean directional bias, and maximum efficiency around a defined strike. This position implies high conviction around $115K in the short term, but without overexposing the trader to directional risk. Let’s see if price action follows the flight path.
Bottom Line
Bitcoin’s price momentum remains intact, but the options market is signaling caution beneath the surface. While expiries continue to settle above max pain and upside bets persist, implied volatility remains suppressed and positioning leans hedged. From balanced straddles to a precise $115K butterfly, traders appear bullish—but not without a plan for downside. The message is clear: optimism remains, but so does discipline.
Disclaimer
This report is for informational purposes only and does not constitute financial advice or a recommendation to buy or sell any financial instruments. Trading digital assets involves significant risk. Always conduct your own research and consult a professional advisor before making investment decisions.