Introduction
May wrapped with yet another bullish expiry—its fifth in a row—but beneath the surface, signs of prudence and positioning discipline continue to shape the options landscape. This week’s Outlook revisits the structural significance of the 30 May expiry and traces how sentiment evolved in its aftermath, from shifting open interest to dealer gamma exposure and a continued compression in implied volatility.
We also explore how traders are positioning into June, including a sharp look at recent flows for the 6 and 13 June expiries. And in the Spotlight: two high-conviction block trades—one precise, one more defensive—offering a clear view into diverging expectations as the market transitions into a new month.
Market Snapshot
Expiry Recap – 30 May 2025
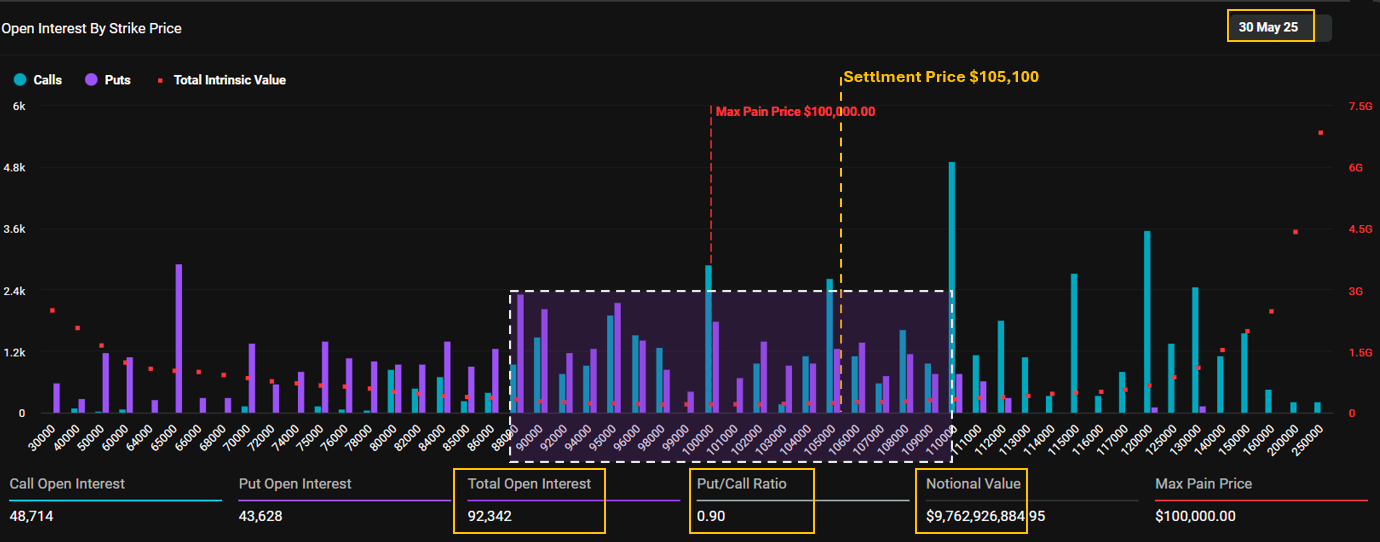
The final expiry of May lived up to expectations, closing at $105,100, well above the max pain level of $100,000. This marks the fifth consecutive Friday where expiry favored call holders — a fitting conclusion to a month defined by bullish momentum and the all-time high of $112K.
From a structural perspective, the 30 May expiry was significant, with over 92,000 open contracts and $9.7 billion in notional value, making it the second-largest expiry of the year so far.
While many call options finished in the money — especially those positioned around the $100K and $105K strikes — ultra-bullish positions targeting $120K or higher may have fallen short. Traders betting on a sustained breakout likely felt the weight of the modest pullback from ATH levels.
Yet, what stands out in this expiry is not just the scale, but the sentiment. The open interest chart continues to show a shoulder-to-shoulder pattern of calls and puts between the $90K and $110K range — a straddle-like setup reflecting uncertainty rather than confidence. This repeated formation across expiries suggests traders were consistently hedging upward moves with downside protection.
Many of these straddles — especially those opened when BTC was around $90K or later at $110K–$112K — may have yielded modest profits or, at the very least, offered meaningful protection into the correction. The slight drawdown from ATH to the $105K settlement ultimately served both cautious bulls and savvy short-vol traders.
For this expiry, the market favored discipline over aggression — rewarding options writers and well-timed call buyers, while leaving cautious straddle holders modestly in the green or effectively hedged.
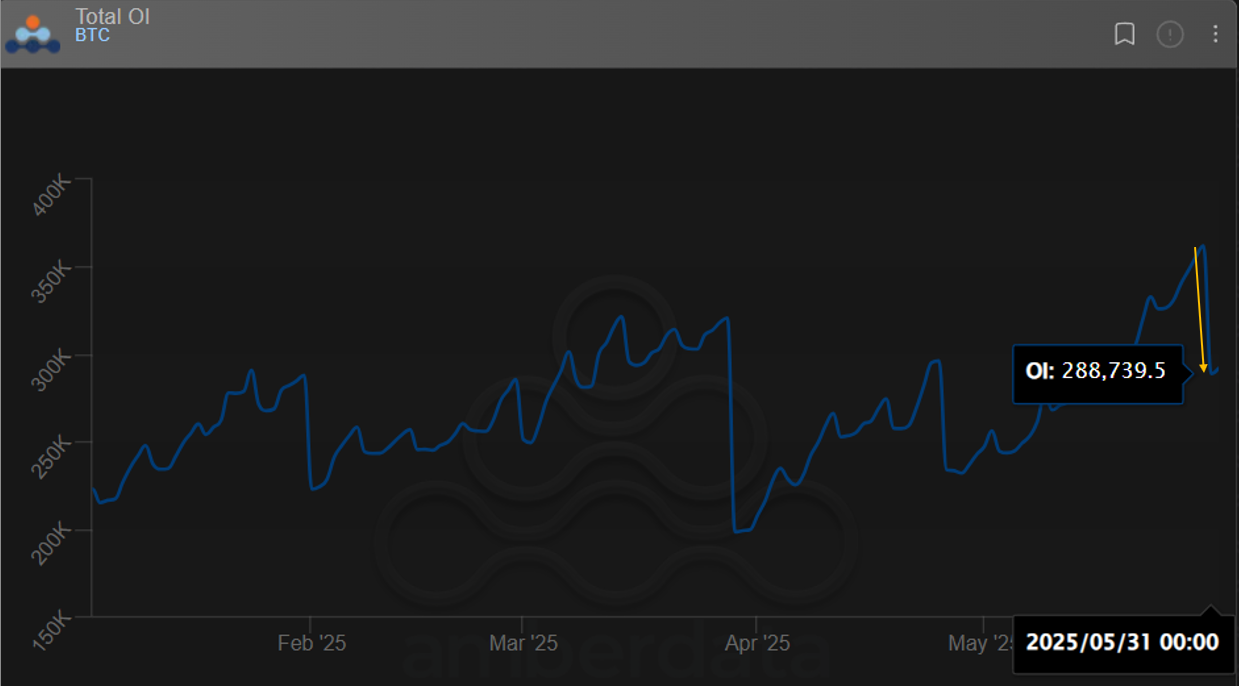
As the 30 May contracts expired, we observed a notable drop in total open interest across Bitcoin options on Deribit — a clear post-expiry contraction illustrated in the chart above.
Macro View: Optimism Without Over-hedging
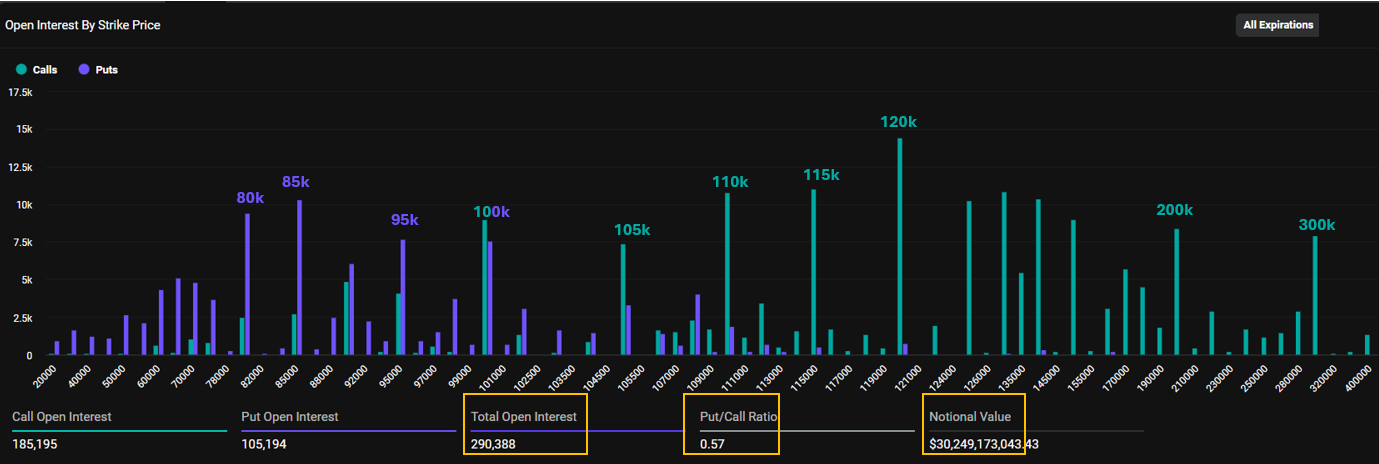
Zooming out to the full-term open interest across all expiries following the 30 May settlement, the broader structure remains firmly optimistic. With a Put/Call Ratio of just 0.57 and a clear dominance of out-of-the-money call positioning, the market continues to lean bullish. Notably, there are only a handful of defensive put positions at distant strikes — signaling limited concern over near-term downside risk.
Next Friday’s Expiry: Risk Reversal in the Making?
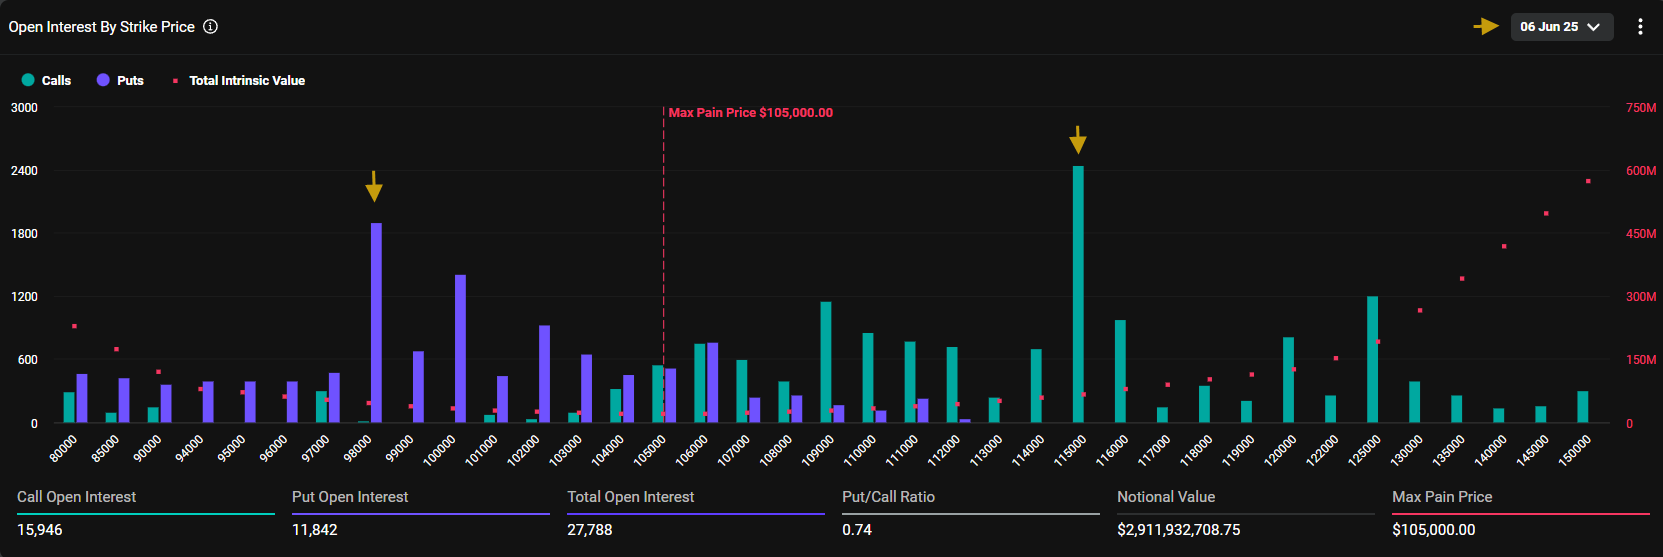
Looking ahead to the 6 June expiry, we observe a moderate total open interest of nearly 28,000 contracts. Among the strikes, $98K and $115K stand out distinctly, each carrying substantial volume.
Interestingly, their positioning evokes the profile of a classic Risk Reversal strategy — selling an out-of-the-money put (at $98K) to fund the purchase of an out-of-the-money call (at $115K). While not confirmed as a structured trade, the configuration implies a market leaning toward bullish continuation, yet hedged with downside tolerance. That said, with less than a week to expiry and the underlying still well below $105K, interpreting this as a fully directional bet may be overly optimistic. Later, we’ll take a closer look at where option buyers are currently concentrated — and how that aligns (or doesn't) with this positioning.
Dealer Gamma Exposure: Option Buyers Cluster Around $100K–$105K
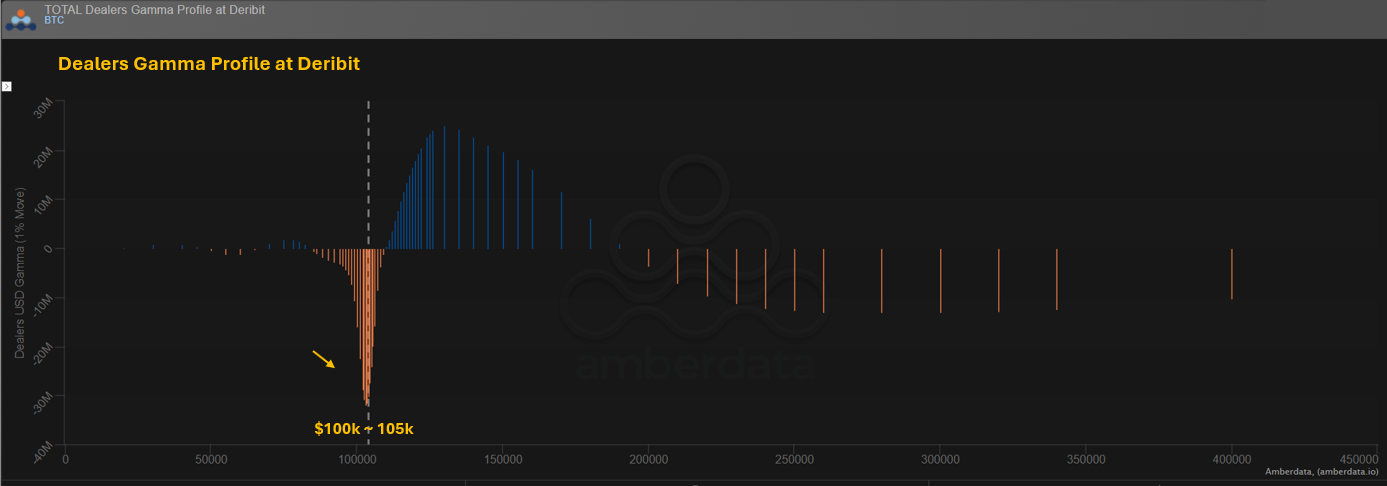
To gauge where option buyers are most concentrated, we analyze the dealer gamma profile from Deribit. In this chart, the negative gamma zones (orange bars) highlight strikes where dealers are short. These areas reflect where buyers have accumulated long positions most aggressively.
As shown, the most significant cluster is clearly centered around the $100K to $105K range.
Less and Less Implied Volatility
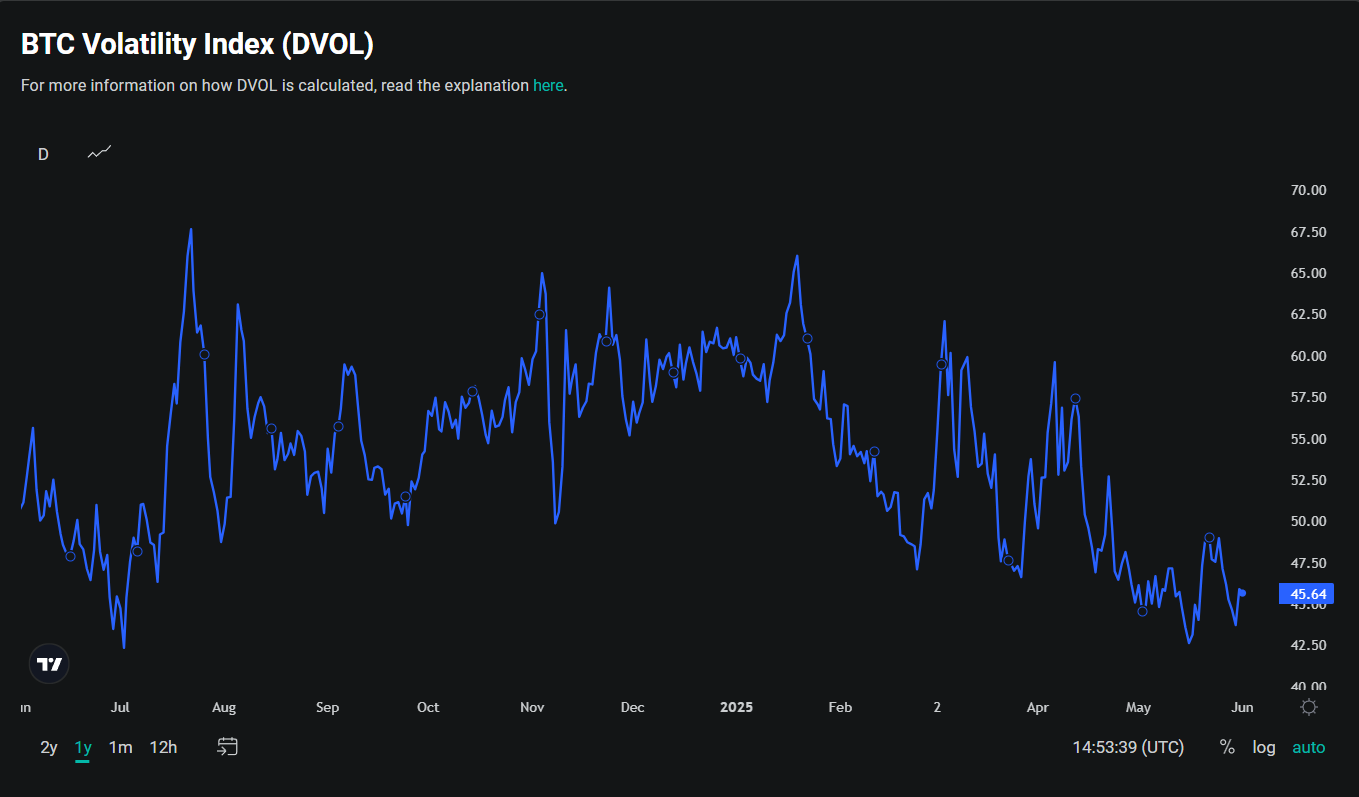
While Bitcoin reached a new all-time high near $112K on May 22 and subsequently corrected to $105K, the implied volatility in the options market barely moved. As shown in the DVOL chart above, the volatility index fluctuated within a narrow band between 42% and 49% throughout May.
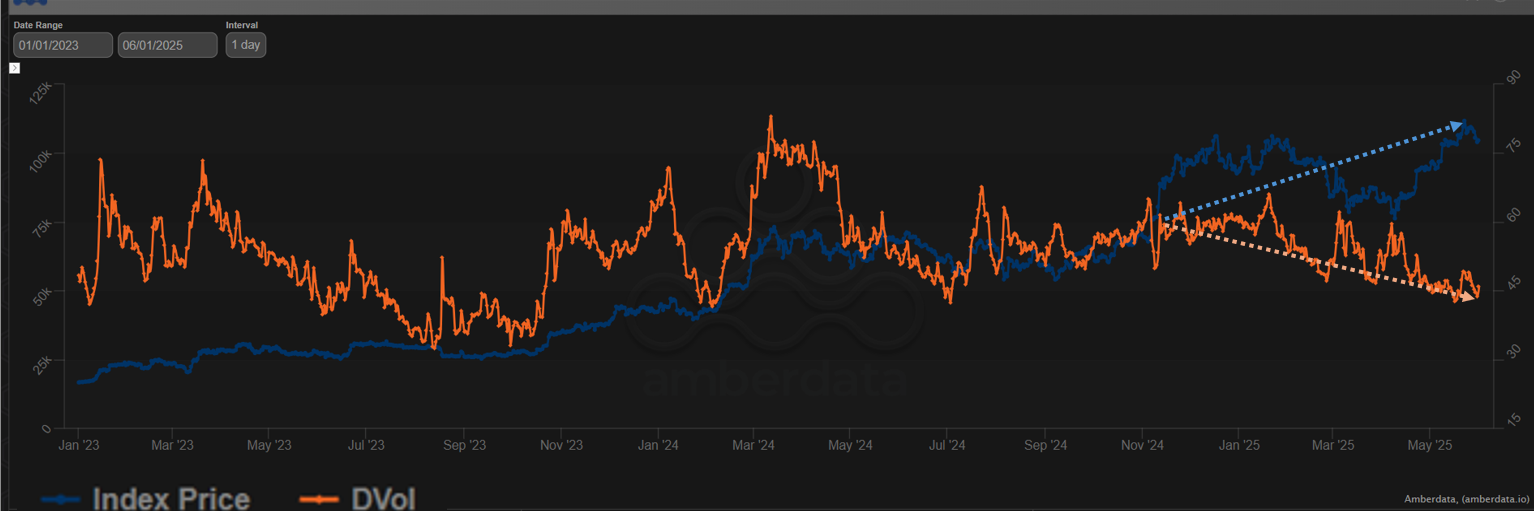
The chart above highlights a striking divergence: while Bitcoin's spot price has surged from $60K to over $100K since November 2024, implied volatility — measured by DVOL — has steadily declined. In fact, the current bull run is unfolding in a calm volatility environment.
As noted in previous Outlooks, the IV domain appears to have structurally compressed. The recent rally has not been accompanied by the volatility spikes typical of past cycles.
Vol of Vol
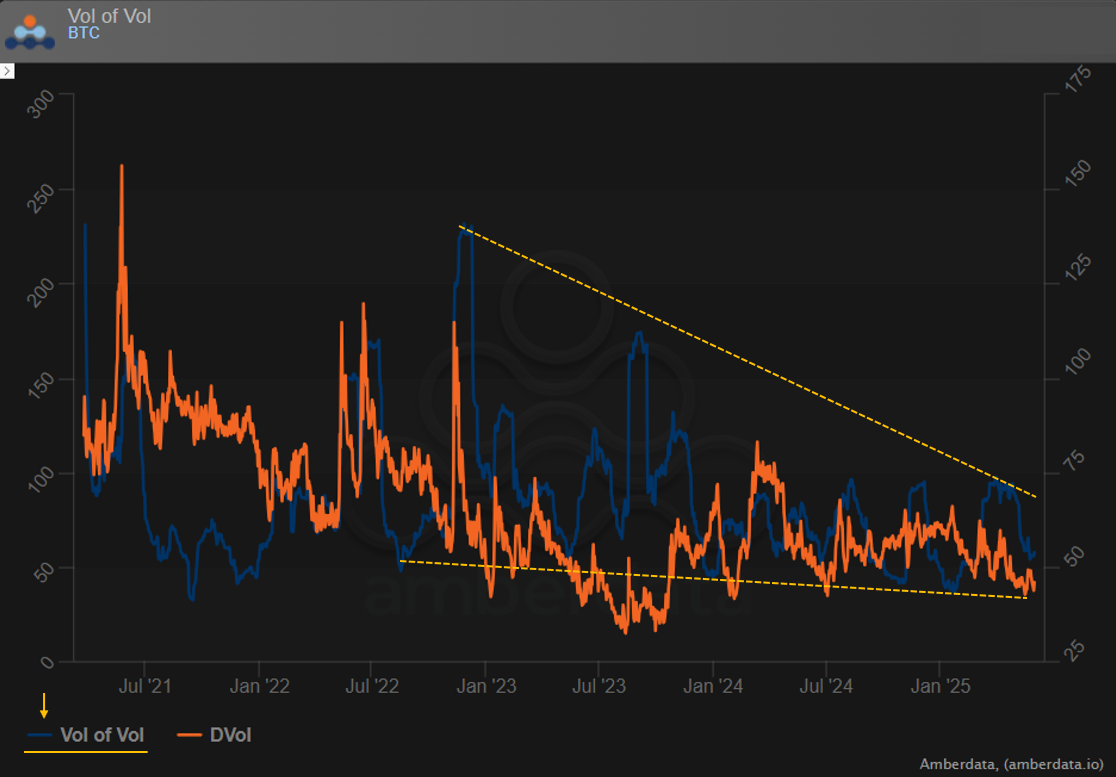
The chart above tracks not just implied volatility (DVOL), but the volatility of that volatility — a deeper layer of market sentiment often overlooked. As shown, both DVOL (orange) and its own volatility (blue) have been trending lower over the past two years.
In effect, it’s not just that the Bitcoin options market is calmer and more mature— it’s that even the noise within the noise is fading.
Recent Activities
Heatmap
(OSS)
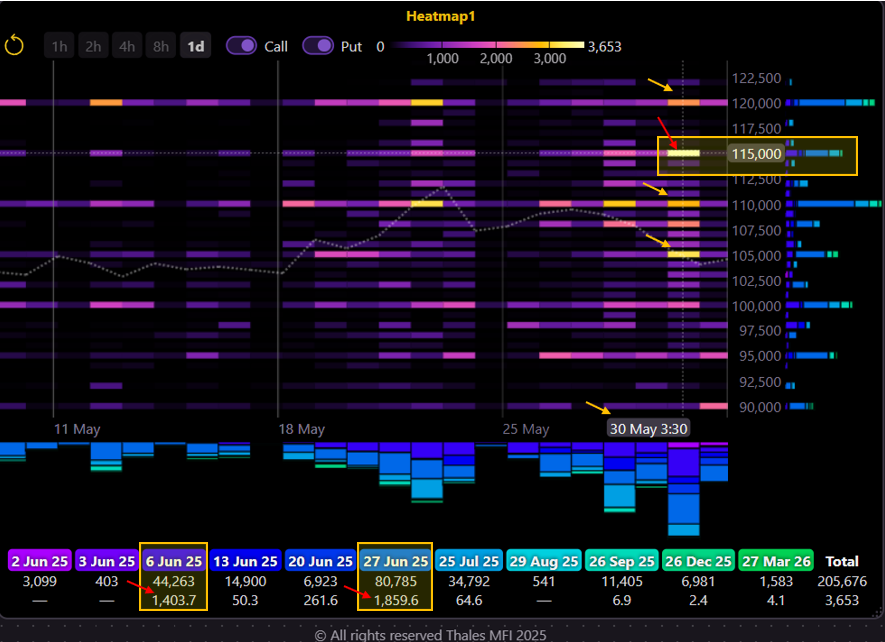
To assess recent activity at a glance, we turn to the Thales Heatmap. As the chart highlights, May 30 saw a notable burst of trading interest, particularly around the $115K strike. Other active zones included $105K, $110K, and $120K.
The $115K strike stands out with sustained volume across both the 6 June and 27 June expiries. This dual focus may hint at a calendar spread strategy — selling the near-term call (6 June) while buying the longer-dated one (27 June). Either way, it signals an expectation that BTC could breach the $115K level, whether soon or in the coming weeks.
6 June Expiry
(OSS)
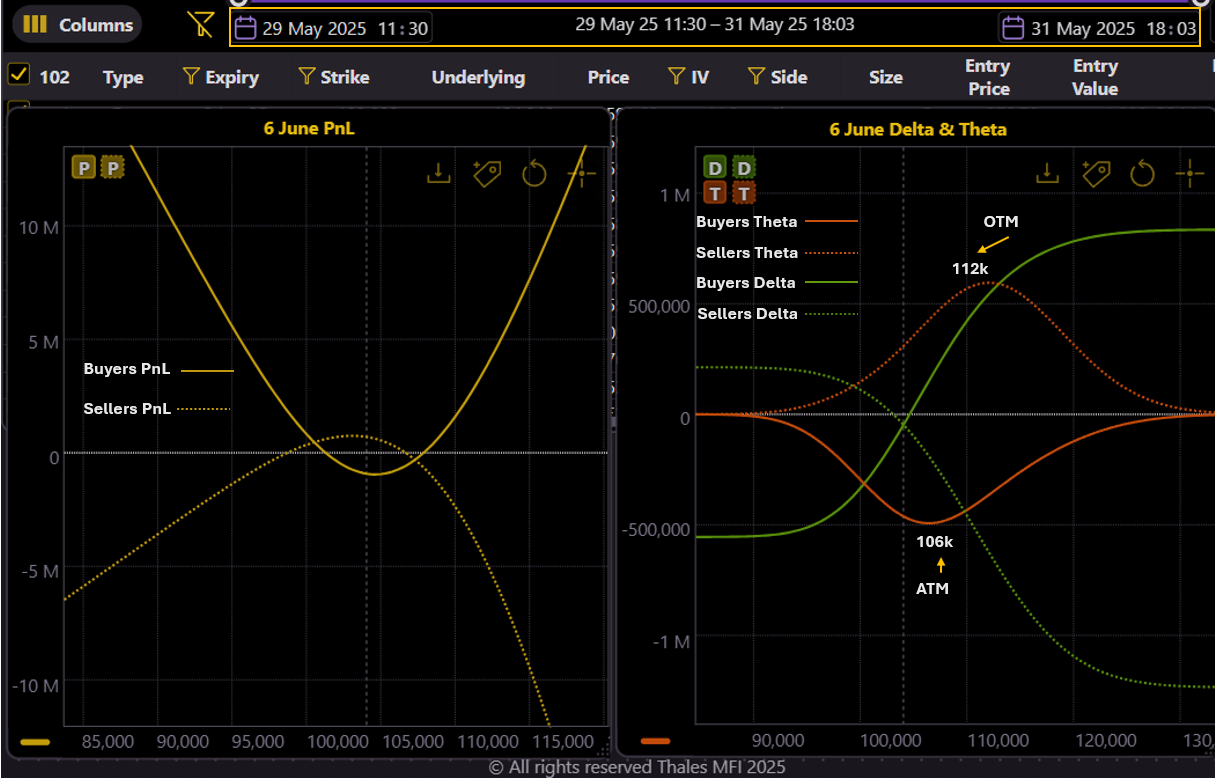
To assess how traders positioned themselves for the 6 June expiry, we used the Market Screener with filters set for entries between 29–31 May, targeting strikes between $100K and $115K. We also separated long and short trades into distinct widgets to examine each side independently.
The PnL and Greeks charts above reflect aggregated flows. Solid lines represent buyer activity (long options), while dotted lines capture seller activity (short options).
From the data:
- Buyers concentrated around the $106K strike, close to the current spot, suggesting a neutral-to-directional outlook with ATM exposure.
- Sellers, by contrast, showed a clear preference for far OTM call writing, with an average strike closer to $112K.
- Looking at delta positioning, buyers appear to have maintained balance between calls and puts—resembling a straddle-style setup.
- Sellers, however, are heavily skewed toward short call exposure, as seen in the sharp slope of the dotted green delta curve.
13 June Expiry
(OSS)
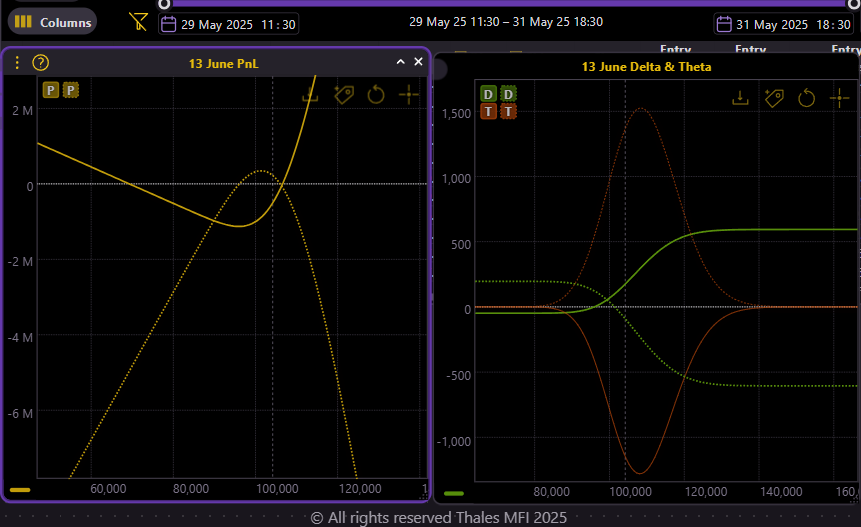
For the 13 June expiry, the aggregated positioning from trades entered between 29–31 May reflects a relatively typical structure, with a mild bullish tilt on the long side. As shown in the Delta profile, buyers exhibit higher positive delta, indicating a preference for call options, while the put-side delta remains closer to neutral. This suggests that traders were more willing to pay premiums for upside exposure over the coming two weeks.
On the short side, positioning appears more balanced and neutral, with call and put activity more evenly distributed around the current spot price. The seller profile aligns with what we generally expect from premium sellers—targeting a stable market within a defined range.
Explore these market dynamics firsthand with the Thales Options Strategy Simulator (OSS)
Strategy Spotlight
This week, our Spotlight features two distinct block trades that reflect diverging outlooks on Bitcoin's short-term trajectory.
6 June Butterfly at 111K
(OSS)
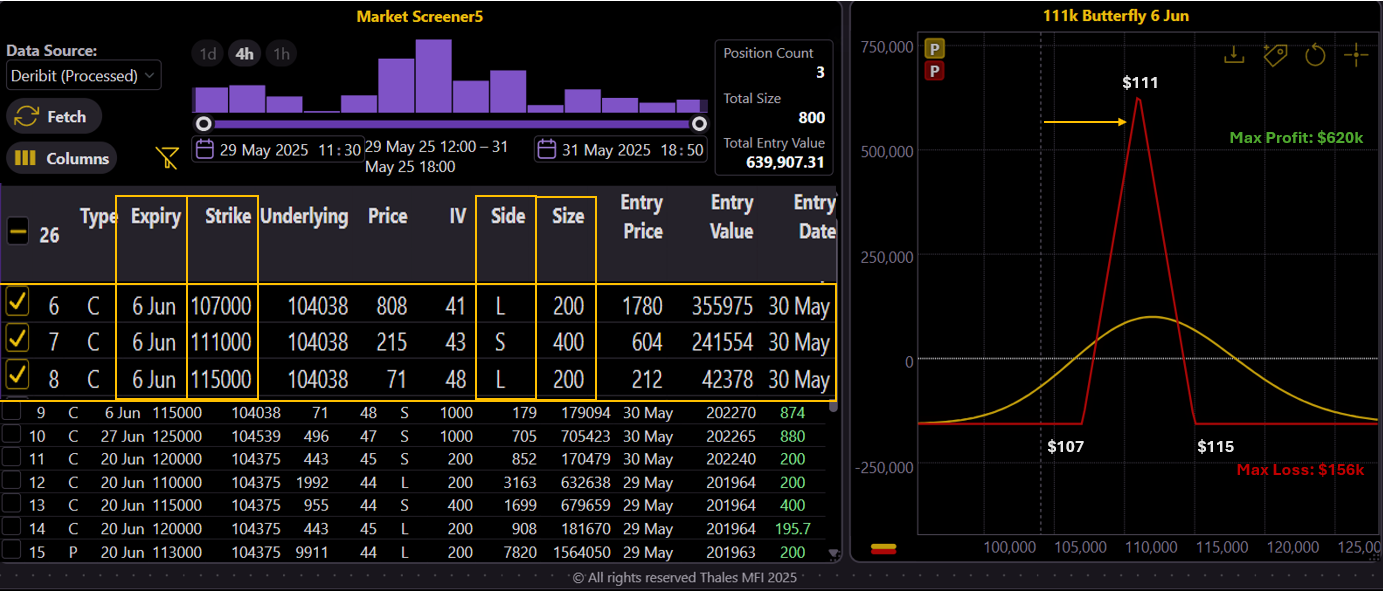
The first is a call butterfly spread targeting $111K for the 6 June expiry. Executed with a total size of 800 contracts, the structure includes:
200 long calls at $107K
400 short calls at $111K
200 long calls at $115K
This strategy is a classic, cost-efficient approach to target a specific price level. With symmetric wings placed $4,000 apart from the central strike, the trader is aiming for a pin at $111K. The max profit reaches $620K if BTC settles right at the center, while the max risk is $156K, defined and limited.
20 June Bearish Ladder
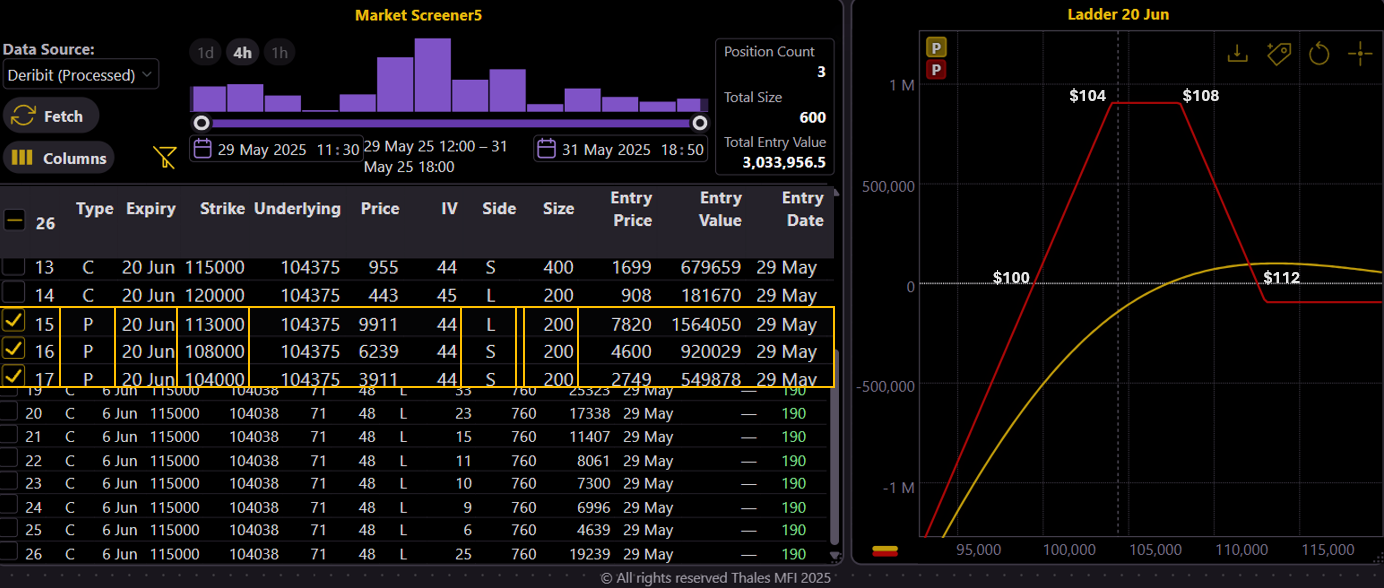
The second trade is a more complex put ladder strategy, set for 20 June expiry. The position includes:
Long 200 puts at $113K
Short 200 puts at $108K
Short 200 puts at $104K
This configuration creates a payoff profile that benefits most if BTC expires between $104K and $108K, with breakeven boundaries stretching between $100K and $112K. However, the strategy carries unbounded downside risk if BTC drops below $100K—signaling that the trader sees a range-bound to slightly bearish scenario, but not a severe correction.
These two strategies showcase how different market participants position themselves based on their risk tolerance and directional biases. One aims for precision at $111K; the other tolerates broader outcomes but rules out deeper declines.
As always, let the market decide who gets the payoff.
Bottom Line
The 30 May expiry capped off a bullish May, rewarding well-placed call buyers while options writers continued to benefit from a calmer volatility regime. Overall positioning remains upward-leaning, but with less hedging and lower implied vol. As June begins, flow suggests optimism—measured, structured, and increasingly tactical.
Disclaimer
This report is for informational purposes only and does not constitute financial advice or a recommendation to engage in any investment strategy. All views expressed are based on market data available at the time of writing and are subject to change without notice. Trading in digital assets involves significant risk and may not be suitable for all investors.