Introduction
After five consecutive bullish Friday expiries in May, Bitcoin options positioning has taken a more cautious tone in early June. This week’s expiry broke the pattern, settling below max pain and frustrating directional trades. The shift in sentiment is also evident in the upcoming 13 June expiry, where outsized put positions signal renewed downside concern.
In this Outlook, we examine the evolving positioning for the short term, the implications of record-low implied volatility, and the structural trends across the curve. We also highlight two notable block trades — one bullish, one bearish — that offer valuable insight into how traders are navigating this calmer yet increasingly two-sided market.
Explore these market dynamics firsthand with the Thales Options Strategy Simulator (OSS)
Market Snapshot
Expiry Recap – 6 June 2025
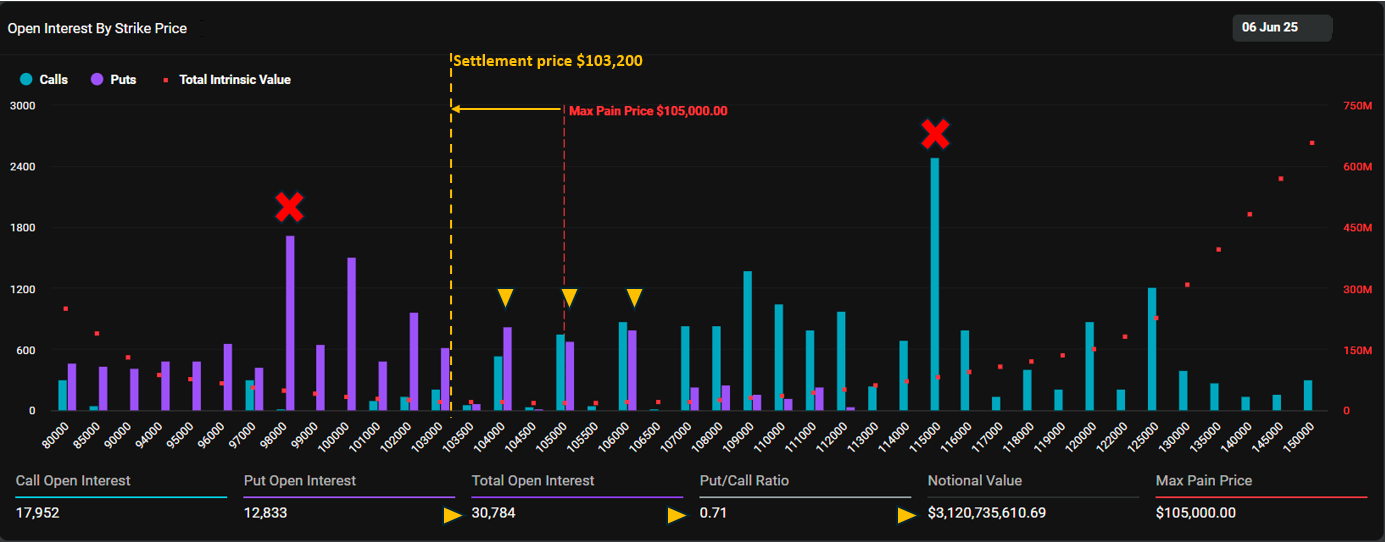
Bitcoin options for the first Friday of June expired at $103,200, falling below the max pain level of $105,000. This contrasts with May’s series of bullish expiries, where every Friday closed above max pain.
The settlement left two key strikes—$115K calls and $98K puts—worthless. As a result, any traders who may have speculated via a risk reversal structure (short $98K put to fund long $115K call) saw that strategy fail to deliver, particularly on the call side.
Meanwhile, traders who employed short-term long straddles to tactically capture each leg of the rally may have fared better. Straddles positioned around $104K, $105K, and $106K likely produced modest gains, with puts ending in the money.
Overall, this expiry, with over 30,000 contracts open, did not reward option holders broadly—settling relatively close to max pain and frustrating directional bets.
That said, the market now shifts focus to next Friday’s expiry, which we’ll explore in the following section.
Looking Ahead – 13 June 2025 Expiry
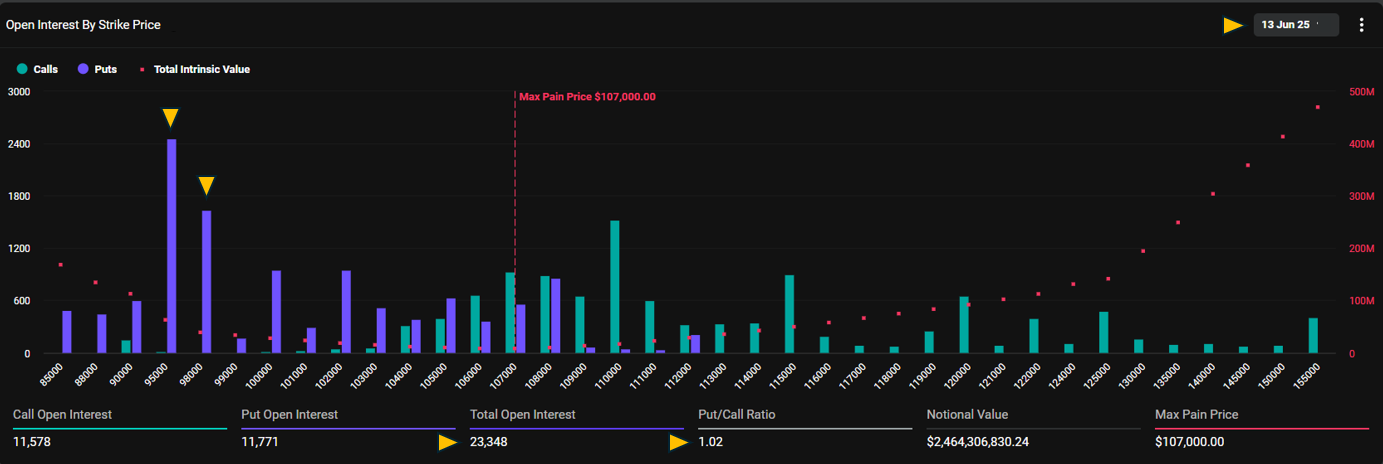
The upcoming 13 June expiry shows a relatively typical size for a Friday, with 23,348 open contracts and roughly $2.5B in notional value.
What stands out, however, is the presence of two outsized put positions at $95K and $98K. These strikes hold significantly more open interest than other options and even rival the well-watched $110K call.
This concentration of downside protection is worth closer scrutiny. Are these puts part of a larger put spread strategy? To answer that, we’ll turn to the Market Screener and investigate how traders are positioning around these strikes.
To investigate the unusual open interest at $95K and $98K puts, we filtered the Market Screener for 13 June expiry, isolating trades on these two strikes.
(OSS)
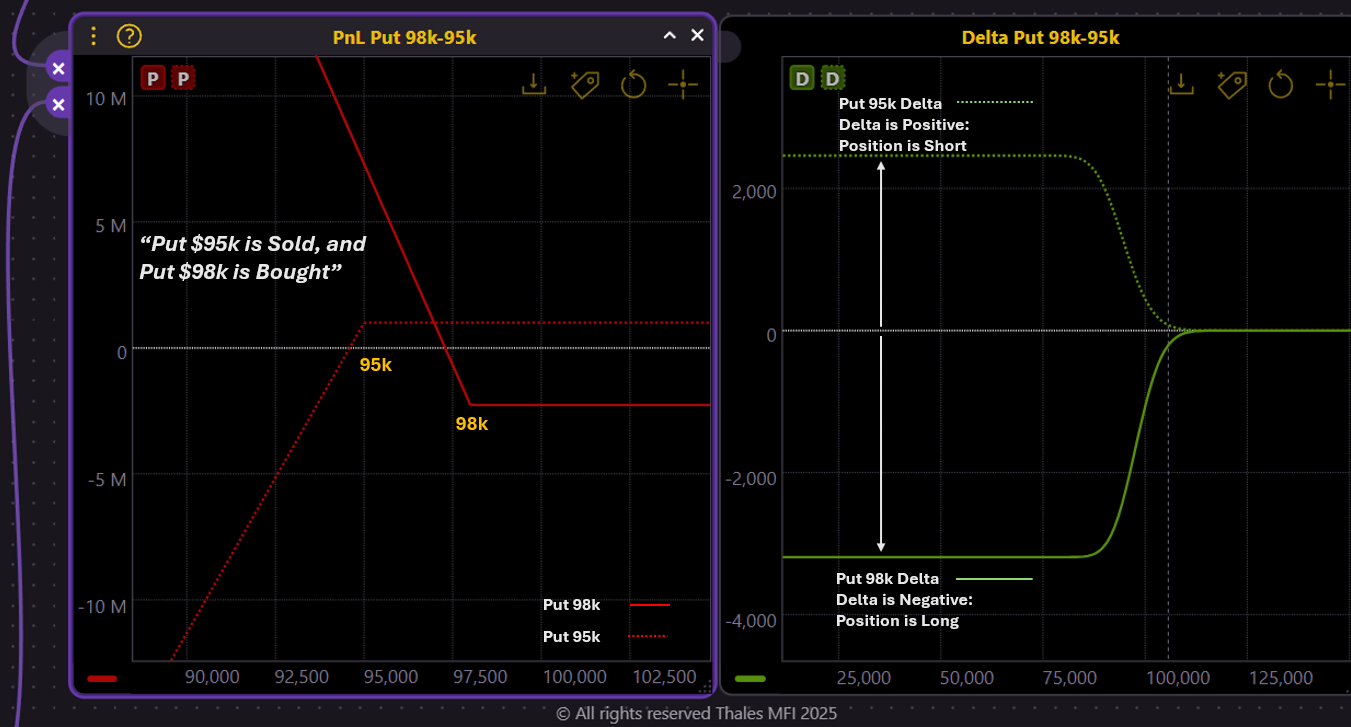
In the chart above, the solid lines represent the $98K put, while the dotted lines correspond to the $95K put. The red curves display PnL, and the green curves show the Delta profile.
The positioning is clear: the $98K put is bought, and the $95K put is sold — forming a classic bearish put spread. Traders applying this strategy are concerned about a potential break below $98K by expiry, but simultaneously view the $95K level as a likely support zone, where they are comfortable limiting further downside exposure.
The bearish tilt we observed in the positioning for the 13 June expiry is also echoed in the dealer gamma profile.
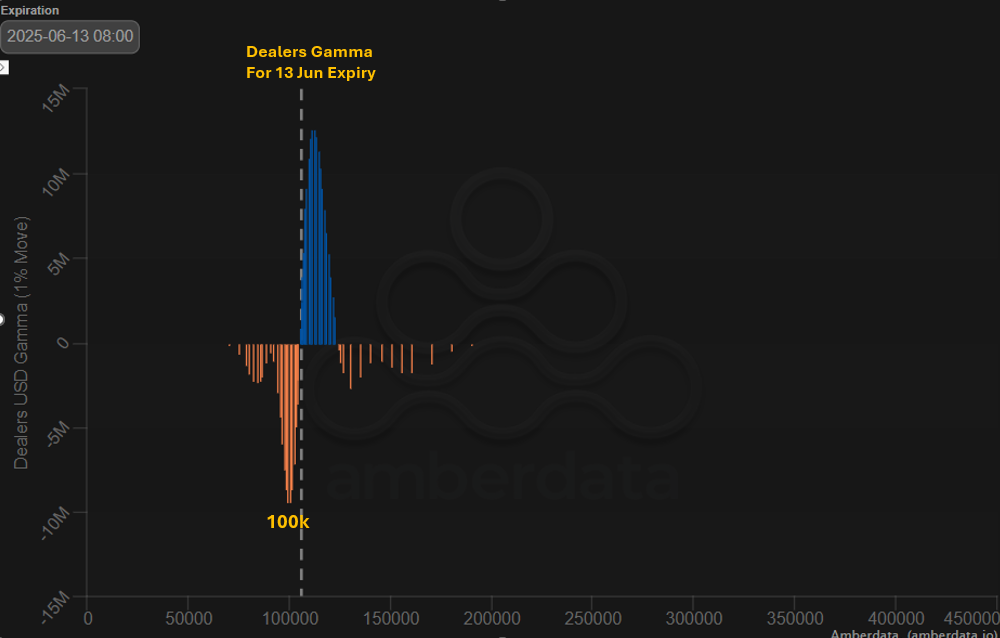
As shown in the chart above, dealers’ maximum negative gamma for the 13 June expiry now centers clearly around the $100K strike — below the current spot price of ~$105K. This suggests that option buyers’ point of concern has shifted below the current market price.
Big Picture
Having examined the positioning around the upcoming 13 June expiry, it is equally important to step back and observe the market's longer-term structure.
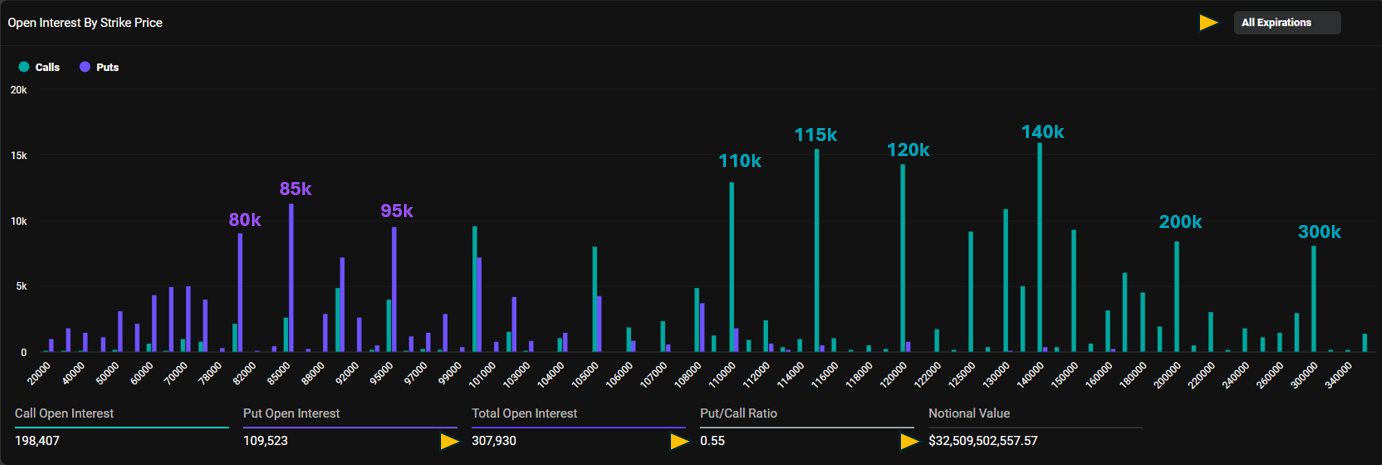
Across all expiries, we now see over 300K contracts outstanding — with nearly two-thirds of that open interest residing in call options. The call positioning is notably skewed toward well out-of-the-money strikes, with significant clusters at $110K, $115K, $120K, and even as far out as $140K. The appetite for deep OTM calls extends into the distant expiries as well, with traders taking advantage of low implied volatility to accumulate positions at the $200K and $300K levels — likely targeting the March 2026 maturity.
On the put side, the picture is far more muted. There is no obvious sign of market-wide fear. The notable put open interest is concentrated at strikes like $95K, $85K, and $80K — suggesting that while some downside protection is being maintained, it remains measured and controlled, not indicative of panic.
Implied Volatility at New Lows
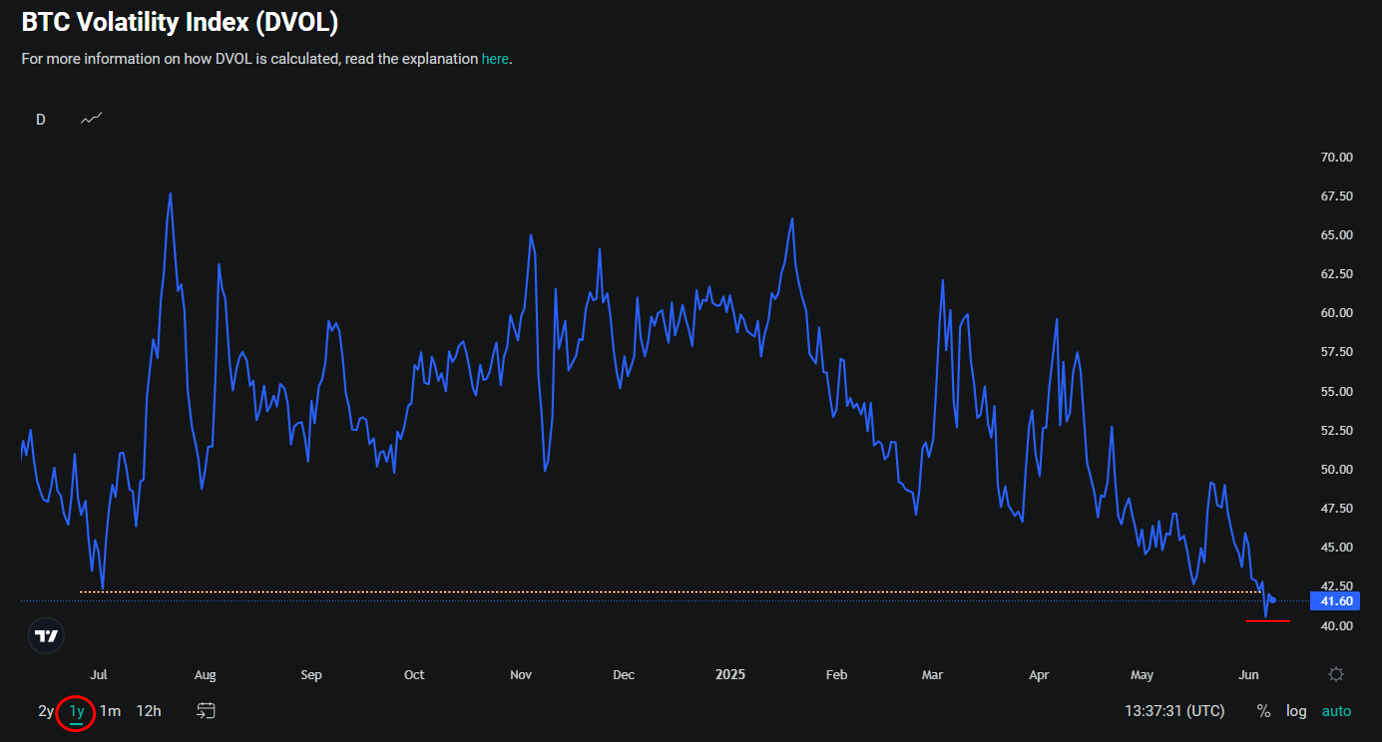
Implied volatility is the pulse of the options market — and that pulse is now strikingly subdued. As shown in the chart above, DVOL has dropped below 42%, marking its lowest level in over a year. Over the past 12 months, the Bitcoin options market has not seen implied volatility this low — a clear signal of diminishing market stress and declining demand for hedging. This unusually calm backdrop sets the stage for potential shifts in positioning ahead.
Recent Activities
Block Combo Trades: Spotlight on Call Diagonal Calendar Spreads
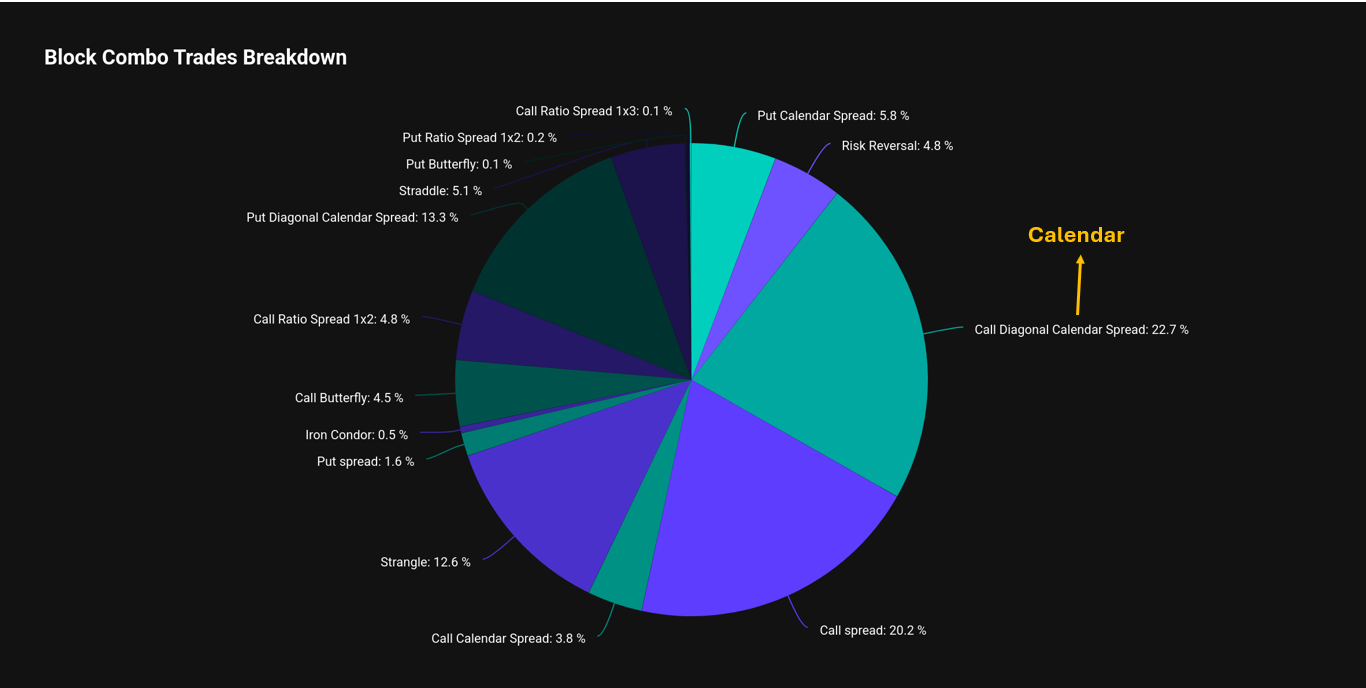
The chart above highlights that the dominant block combo trade over the past week was the Call Diagonal Calendar Spread. This strategy typically seeks to capitalize on shifts in implied volatility rather than directional price moves. Given that we observed earlier that IV is hovering at its lowest levels in a year, it is logical to see traders actively deploying such structures to express views on future volatility expansion — or to lock in premium at historically cheap levels.
Recent Trades for June: Cautious Buyers Positioning for Volatility
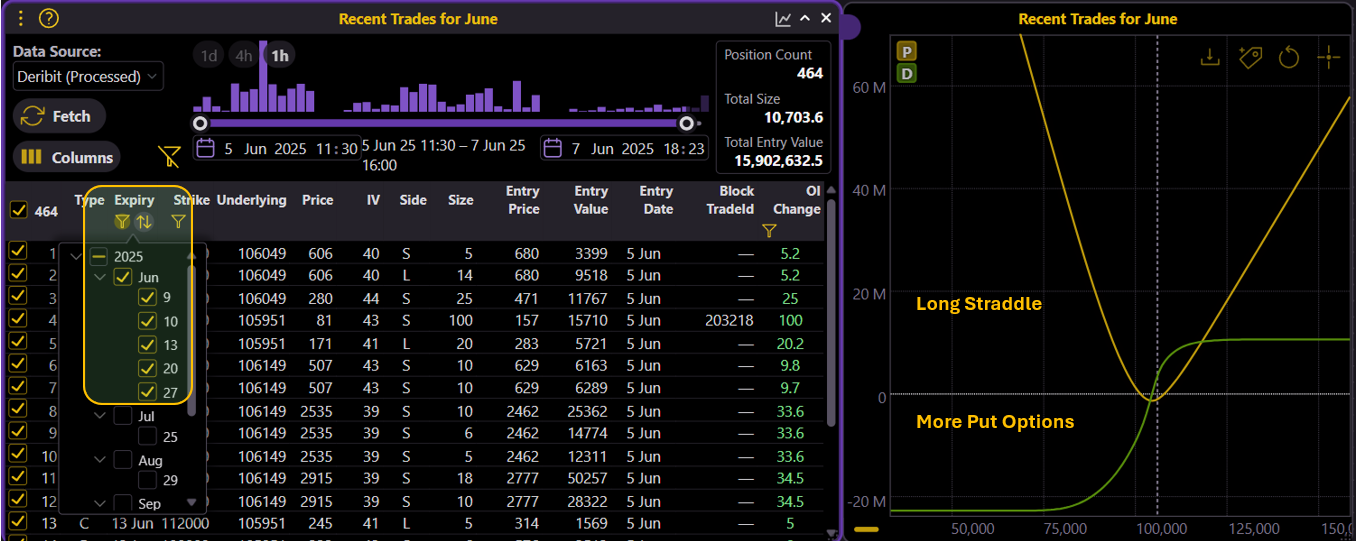
(OSS)
Turning to Thales Market Screener, we examine the most recent trades with expiries filtered for June. The aggregated PnL graph displays a profile similar to a long straddle, but with noticeably heavier put exposure.
This flow suggests that buyers currently have the upper hand — likely a reflection of two factors: 1) the extremely low level of implied volatility, which makes selling options unattractive, and 2) expectations of a meaningful price move in June. However, the skew toward puts indicates a tilt toward caution; while traders are positioning for movement, there is a clear concern that any move could come via a correction rather than a fresh rally. At least in the final days of the past week, protecting downside risk appears to have been a priority.
Strategy Spotlight
This week, we spotted two large combo block trades on Thales Market Screener — one leaning bullish, the other decidedly bearish.
(OSS)
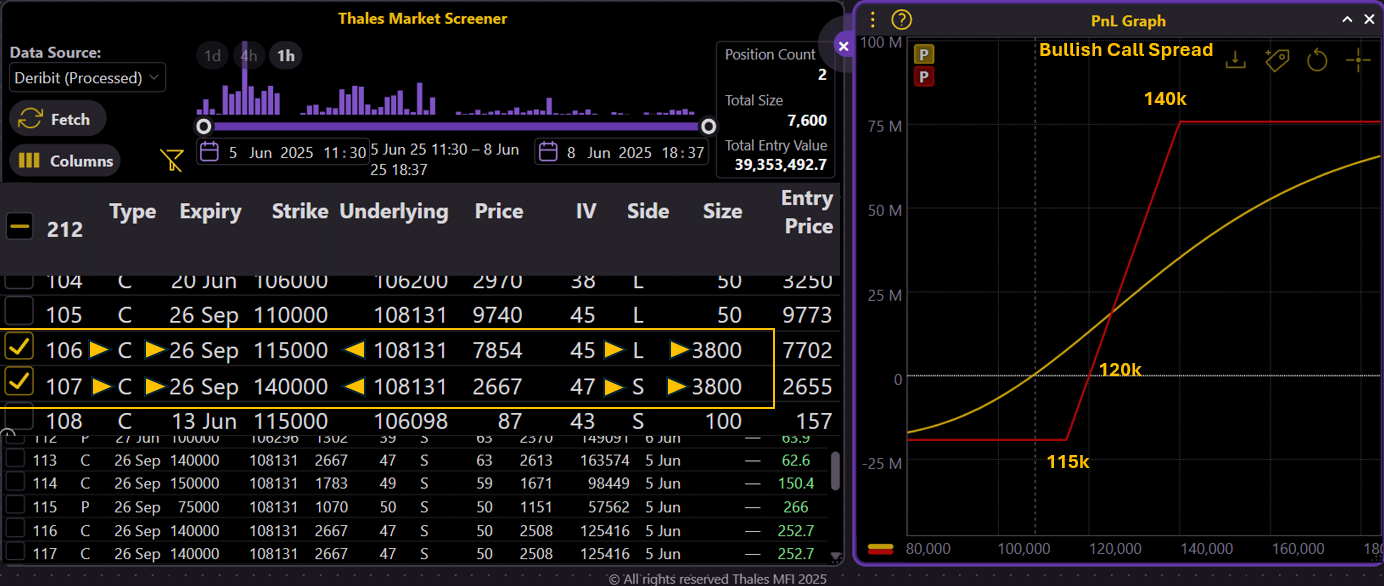
The first is a bullish call spread with heavy size, controlling 7,600 BTC and carrying a notional value of $800M, set to expire on 26 September.
The structure combines 3,800 long calls at a $115K strike with an equal number of short calls at $140K. As the PnL graph shows, the strategy offers a potential payoff of up to $75M should BTC rise to $140K or beyond by expiry. The downside risk is limited to about $20M, reflecting a classic risk/reward skew in favor of a strong late-year rally.
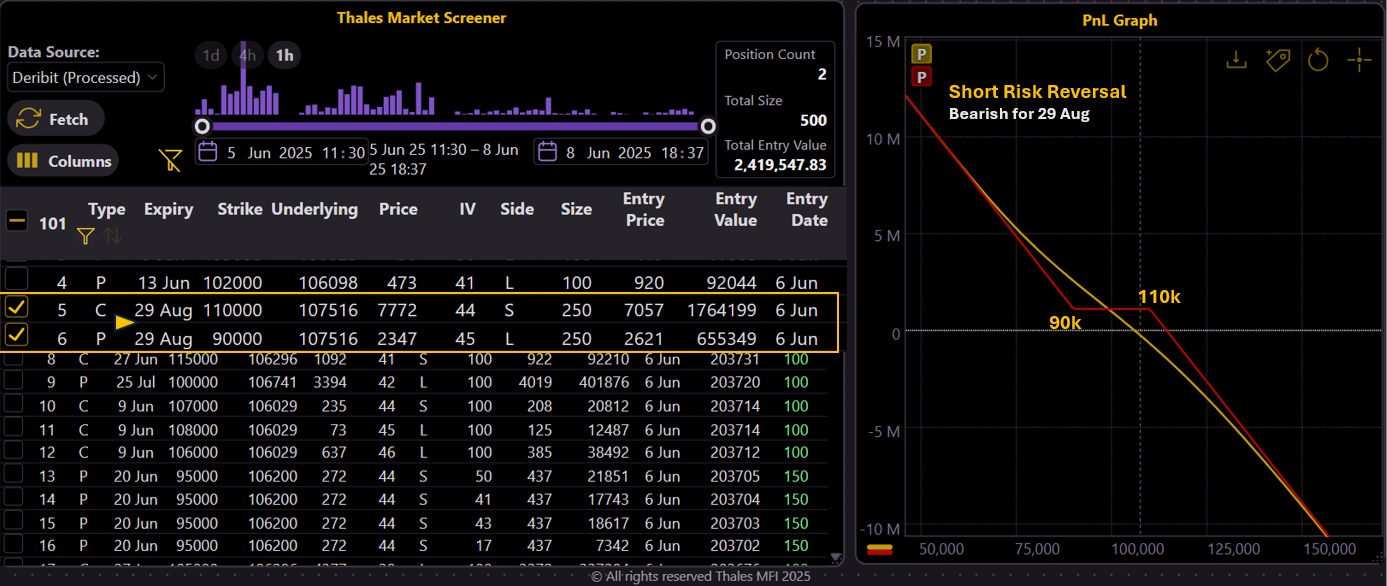
The second is a bearish short risk reversal expiring 29 August — lower in size but sharper in directional stance.
(OSS)
The trader sold 250 calls at $110K and used part of the premium to fund 250 long puts at $90K, capturing a net credit and setting up an asymmetric payoff. Between $100K and $90K, the position can generate ~$1.1M in profit, but the real opportunity lies if BTC breaks below $90K, where gains become open-ended. The decision to spend premium on puts signals stronger bearish conviction rather than a neutral-to-mild stance.
As always, the market reflects opposing views — one positioning for a breakout in late Q3, the other for deeper downside in the coming months. Perhaps both can play out in sequence — time, as ever, will tell.
Bottom Line
With implied volatility at new lows and directional conviction more balanced, the Bitcoin options market is entering a phase of tactical recalibration. Near-term flows reveal growing caution, while longer-dated call buying suggests traders remain positioned for potential upside in late Q3 and beyond. The opposing views highlighted in this week’s block trades remind us that the path ahead is far from one-dimensional — and in a low-IV regime, sharp moves remain a distinct possibility.
Disclaimer
This Outlook is provided for informational and educational purposes only and does not constitute investment advice or a recommendation to buy or sell any financial instruments. All opinions expressed reflect current market observations and are subject to change without notice. Trading in derivatives involves substantial risk and may not be suitable for all investors.