Introduction
Bitcoin’s breakout above $118,000 has reshaped the landscape for derivatives traders, shifting the moneyness of major call strikes and accelerating fresh positioning ahead of the 18 July expiry. In this week’s Outlook, we explore how short-term volatility briefly surged before retreating, examine the structural suppression of implied volatility despite new highs, and highlight key areas of recent trading activity, from the $118K–$120K strike zone to longer-dated short strangles. Our strategy spotlight features three notable block trades — a bearish put spread, a bold short put structure across expiries, and a centered 118K call butterfly — each reflecting a distinct market thesis. Whether directional or neutral, these positions speak to the diverse expectations shaping the weeks ahead.
Explore these market dynamics firsthand with the Thales Options Strategy Simulator (OSS)
Market Snapshot
Expiry Recap – 11 July 2025
Settlement Price: $117,900 | Max Pain: $108,000
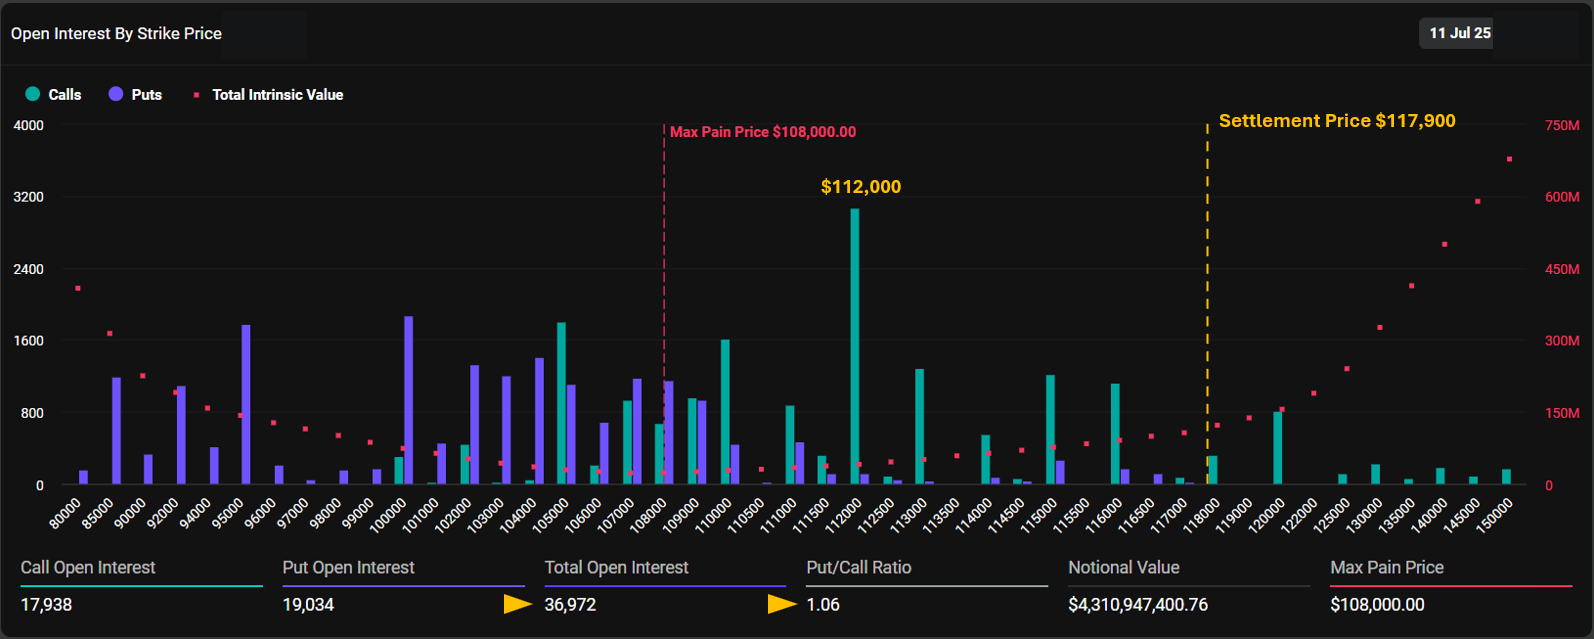
BTC settled at $117,900, breaking above max pain and key resistance. Nearly all puts expired worthless while the largest call strike — $112K — ended deep in the money.
Bitcoin closed the week with a decisive breakout, finishing the 11 July expiry at $117,900, well above both the $112,000 strike (the recent all-time high) and the max pain level of $108,000.
This sharp rally pushed the largest call option cluster — the $112K strike — deep into the money, delivering significant gains for bullish traders who positioned early. At the same time, nearly all of the ~19,000 open put contracts expired worthless, making this expiry highly unfavorable for put holders and more broadly for sellers of underpriced call volatility.
Notably, the put/call ratio was close to 1.06, reflecting a near-even split between calls and puts in terms of open interest. This balance — echoed in the OI distribution around the $105K–$109K strikes — had previously suggested a market lacking strong directional conviction. The OI around these central strikes formed a familiar straddle-like pattern, typical of markets in uncertainty.
Yet, this Friday proved that bulls were right. The rally didn’t just break resistance — it broke the range and paid out generously to long-call holders, especially those who bought before the move accelerated.
Looking Ahead – 18 July Expiry
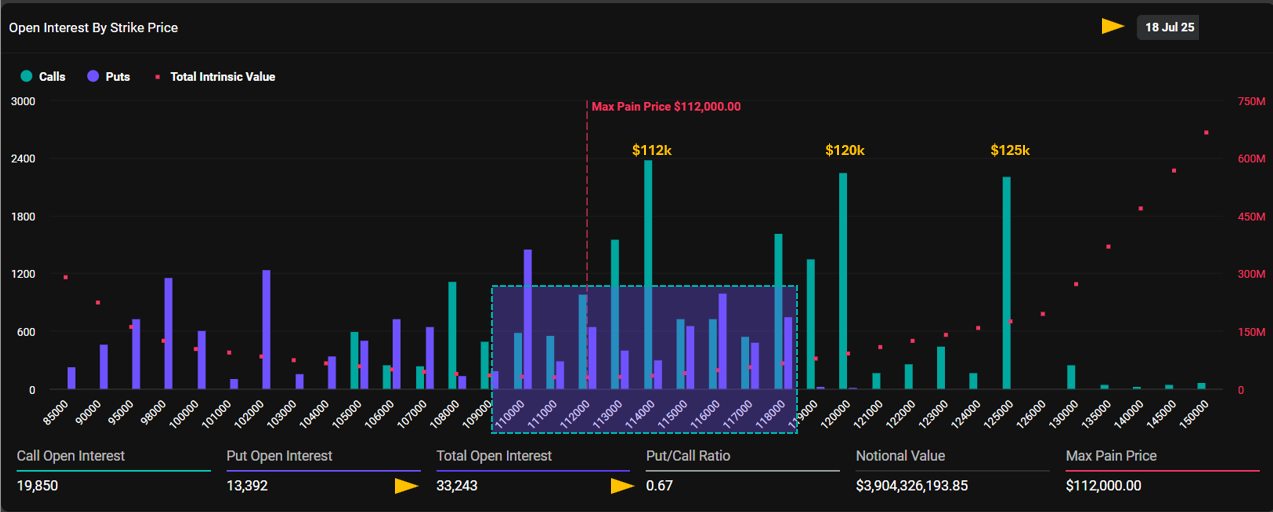
Next week’s expiry (18 July) reflects a bullish bias in positioning, with more than 33,000 contracts open and a put/call ratio of just 0.67. Call open interest outpaces puts notably, with standout clusters at the $112K, $120K, and $125K strikes — a stair-step formation of upside targets that may reflect traders’ expectations for continuation or follow-through from the recent breakout.
That said, the distribution also reveals an area of tactical uncertainty. Between $110K and $118K, open interest in puts and calls sits nearly shoulder-to-shoulder, forming a “straddle-like” band of indecision. This likely reflects a period in which traders expected Bitcoin to stall or correct within that range — a reasonable assumption before BTC’s decisive break above $118K on 11 July.
Calls in the Money
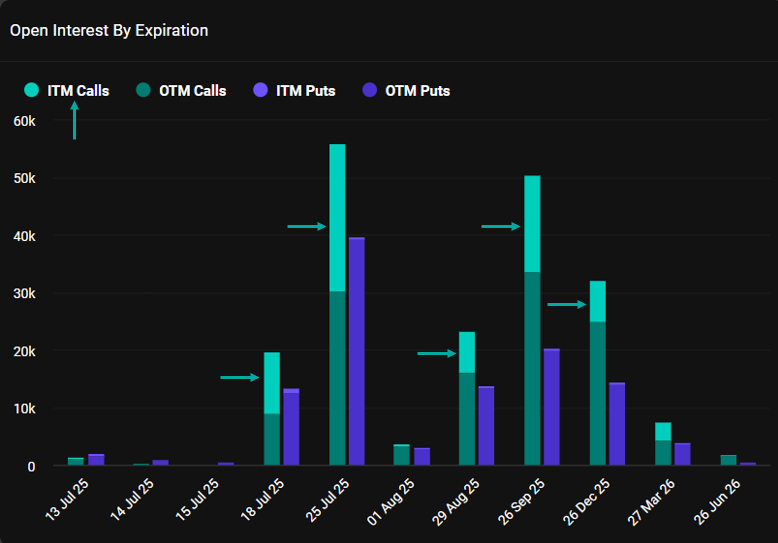
Open interest across expiries shows a surge in ITM calls, especially for 25 July and 26 September, following Bitcoin’s breakout above $118K.
From a broader perspective, the recent price breakout has had a material impact on moneyness across Bitcoin options expiries. As BTC climbs, a substantial portion of existing call open interest has moved into the money .
For example, in the 25 July expiry, nearly 40% of all call positions are now ITM — a sharp shift from just two weeks ago. This pattern is echoed across other major expiries, including 18 July, 26 September, and 26 December, where the ITM portion of calls has meaningfully increased.
Implied Volatility Remains Subdued, Even Amid New Highs
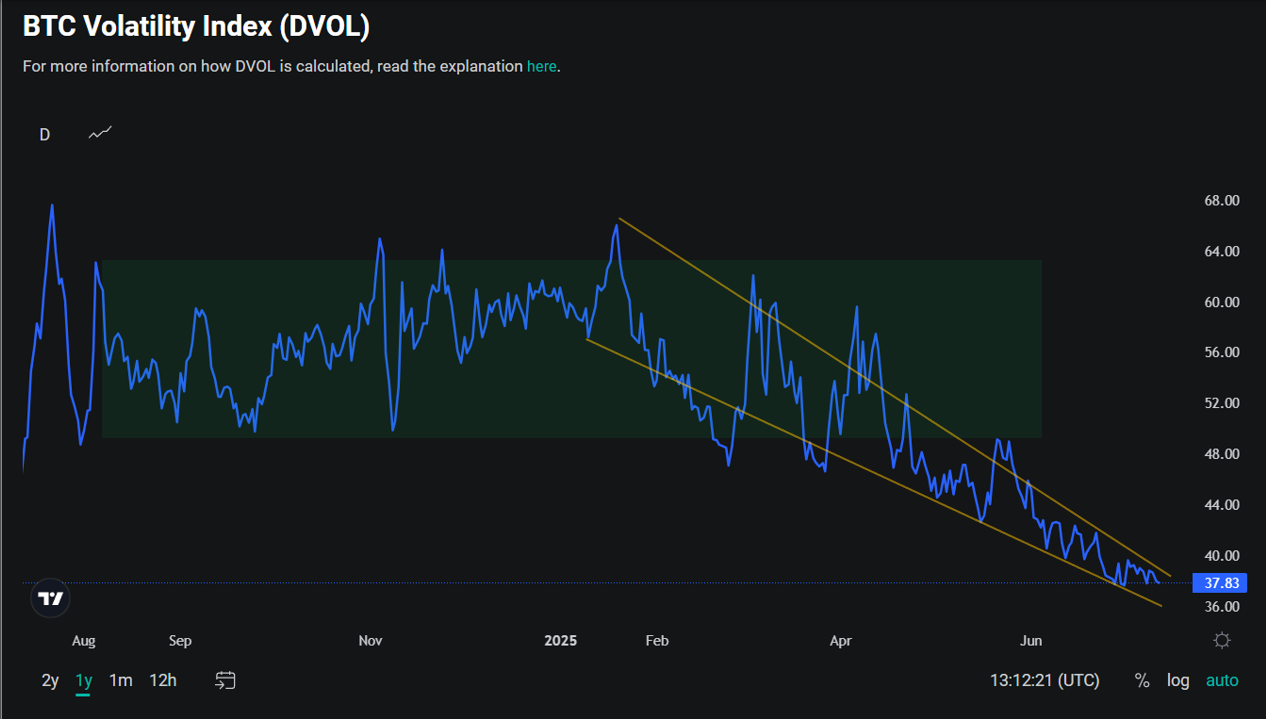
Despite Bitcoin breaking out to a new all-time high of $118,000, implied volatility remains firmly suppressed. As of Friday’s close, the DVOL Index sits at just 38% — remarkably low for an asset known for sudden price swings. Even a historic breakout was not enough to push IV above the 40% threshold, let alone back into the 50%–65% range that previously served as DVOL’s baseline.
Notably, volatility itself has become more stable: the volatility of volatility is shrinking, as seen in the narrowing channel and flattening pattern in the chart. The market increasingly shaped by structural flows and dampened reactions.
Short-Term Volatility Fades Fast
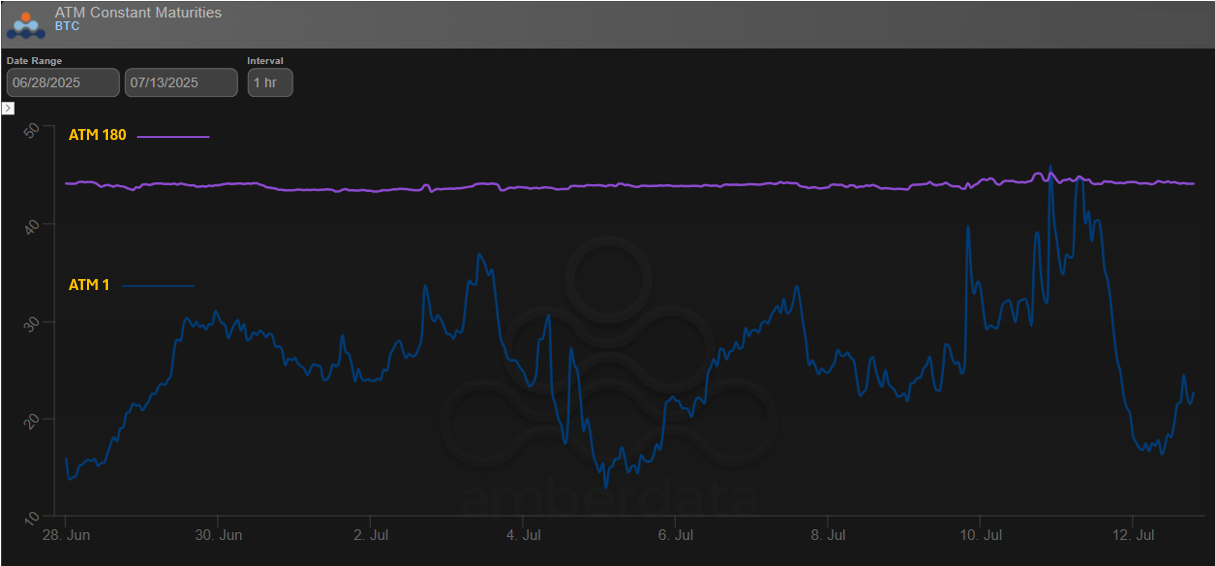
ATM 1D implied volatility spiked ahead of the July 9 breakout but fell sharply afterward, while 180D IV remained stable above 45% throughout.
While the overall DVOL Index reflects structurally low implied volatility, a closer look reveals that not all options are priced the same.
The chart above compares the ATM Implied Volatility for 1-day options (blue) versus 180-day options (purple). While the 180DTE IV has remained remarkably stable and elevated, hovering above 45% throughout recent weeks, 1DTE IV, however, has been highly reactive — spiking on price moves and collapsing just as quickly.
In the days leading up to BTC’s new ATH on July 9, short-term IV spiked in response. But by July 12, it had already crashed back below 20%, showing how quickly surface volatility evaporates.
Recent Activities
Heatmap
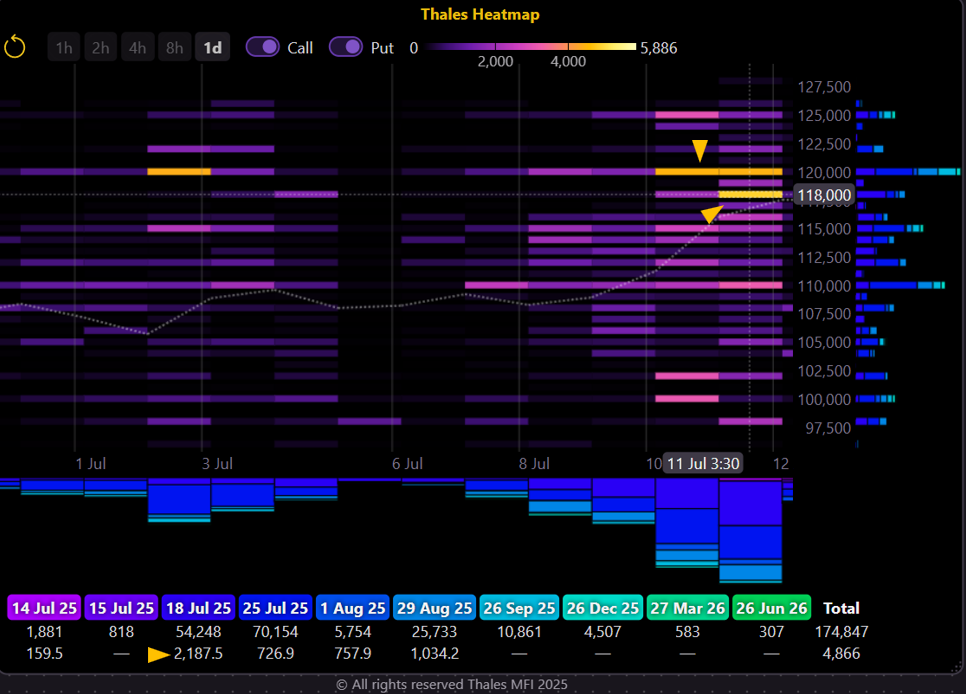
Most active strikes were $118K and $120K on July 11–12, primarily for the 18 July and 29 August expiries.
(OSS)
To assess recent positioning, we refer to the Thales Heatmap. The most traded strikes on 11 and 12 July were clearly $118,000 and $120,000, highlighted in yellow on the chart. These trades were concentrated in the 18 July and 29 August expiries, as shown by the horizontal and vertical axis alignment. The color density at these strikes indicates increased call activity following Bitcoin’s breakout, with traders likely positioning for continued upside or defending new levels after the move.
Market Screener
18 Jul
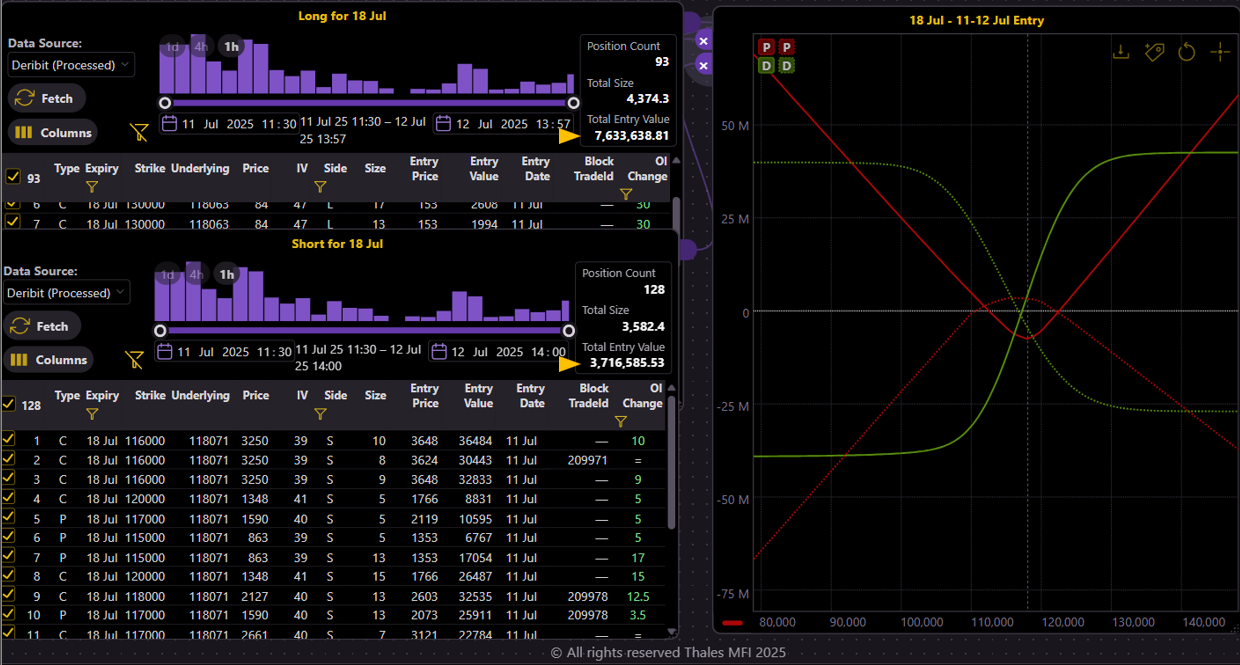
Buyers opened over 4,300 contracts, paying $7.6M, while sellers collected just $3.6M. Positioning resembles a long straddle, with a slight bullish tilt reflected in the net delta.
(OSS)
To better understand traders' recent positioning, we turn to the Market Screener, filtered for 18 July expiry and trades executed on 11 and 12 July. The upper widget displays long positions — trades where traders paid a premium to buy calls or puts. In this window, buyers committed more than $7.6 million in premium across 4,374 contracts, split between call and put options. The lower widget shows the short side of those trades — options sold during the same period — with a total of 3,582 contracts bringing in just under $3.6 million in premium.
The graph combines both widgets to visualize the net positioning. Solid curves reflect the payoff and delta exposure of long trades, while dotted lines represent the short positions. The yellow (delta) curve for the long side indicates a fairly balanced straddle structure centered around the $118K area, implying that many buyers were positioning for a large move but with no strong directional bias. On the short side, however, strikes are more dispersed — with a heavier focus on selling puts — pointing to modest bullish leanings among sellers.
Longer outlook
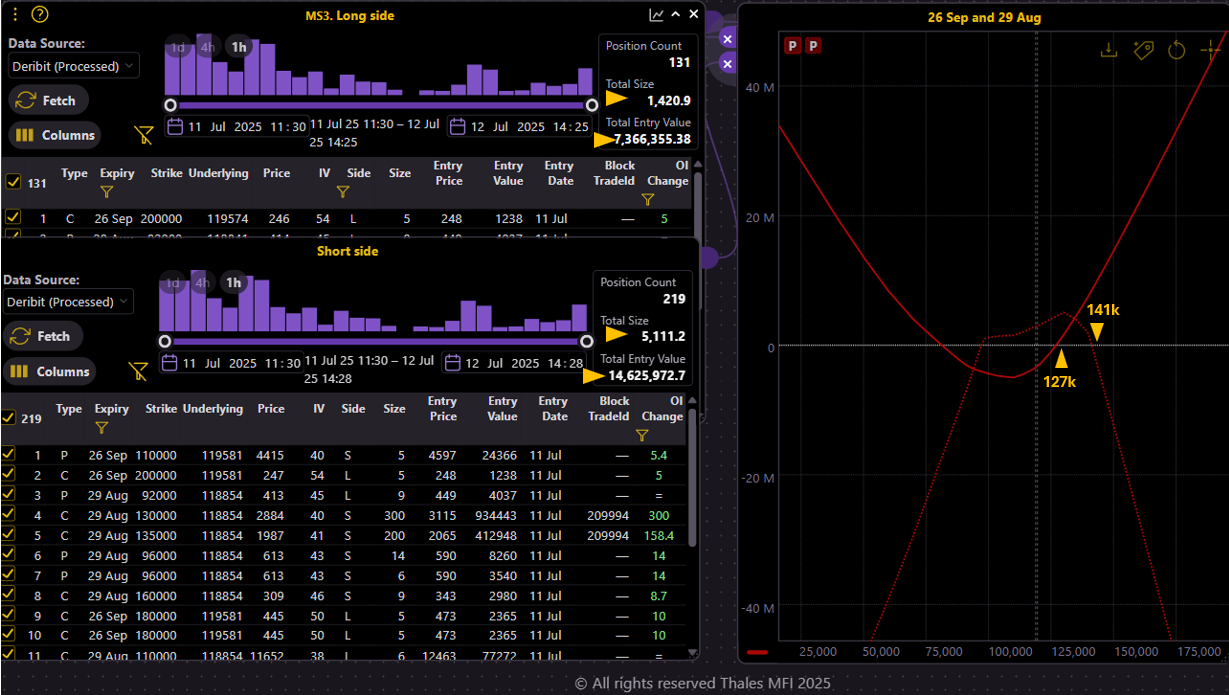
The chart illustrates recent positioning on the Thales Market Screener, revealing a large-scale short position deployed across August and September expiries.
(OSS)
Turning to longer-dated expiries, we analyzed trades entered on 11 and 12 July for the 29 August and 26 September expiries. The Market Screener results once again separate long and short positioning. The upper widget captures long-side entries (option buyers), which total just over $7.3 million in premium for 1,420 contracts. In contrast, the short side — shown in the lower widget — is far more dominant: nearly 5,111 contracts sold for over $14.6 million in collected premium.
This imbalance highlights the behavior of more advanced market participants. On Deribit, where this data is sourced, larger traders appear to favor option selling, in contrast to retail traders who typically buy options. This structural dynamic likely contributes to the suppressed implied volatility regime we've observed in the broader market.
The payoff chart further supports this interpretation. The short-side positioning resembles a wide strangle structure, with a heavier emphasis on call selling. Sellers are protected unless BTC rallies beyond the $141K mark — their approximate collective breakeven point. On the long side, buyers don’t begin to profit until above $127K, implying a neutral zone between $127K and $141K where both camps can remain profitable.
Strategy Spotlight
Bearish Put Spread for 1 August
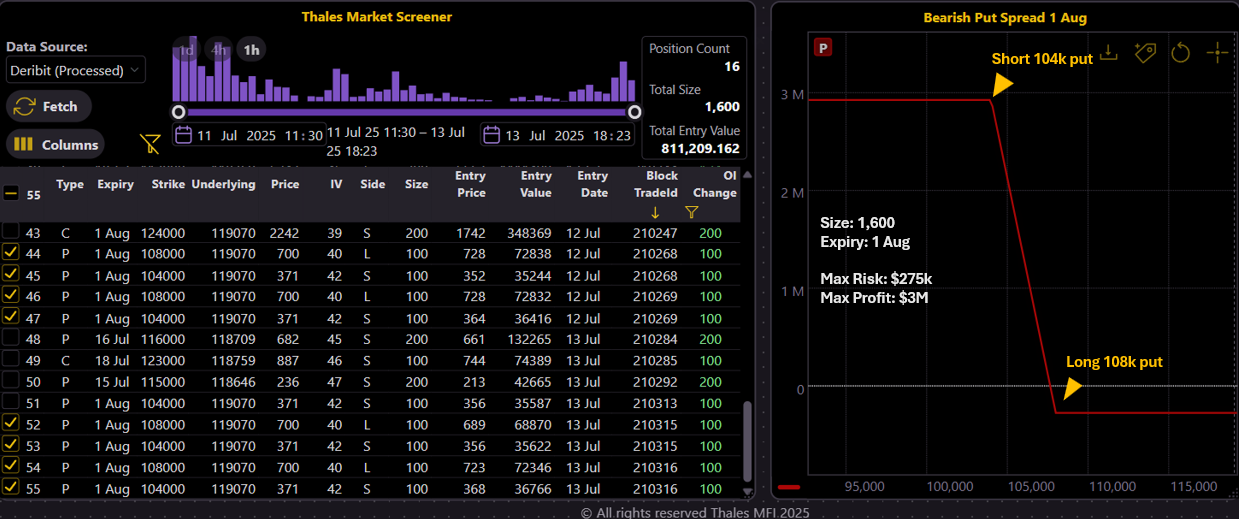
A sizable bearish put spread was spotted in the market screener, combining a short 104k put and a long 108k put for 1 Aug expiry. With a 1,600-contract size, the structure caps max loss at $275k while aiming for a potential $3M profit.
(OSS)
A sizable bearish put spread was spotted in the Market Screener, executed in multiple blocks on 12 and 13 July. The trader deployed a total of 1,600 contracts for the 1 August expiry, constructing the spread by buying 108K puts and selling 104K puts. This structure implies a short-term bearish view, targeting a retracement below $108,000.
If Bitcoin holds above 108K into expiry, the strategy risks a loss of around $275K — a manageable premium outlay given the size. However, should BTC drift back down toward $104K, the payout could reach nearly $3 million, reflecting a favorable risk-reward setup for a controlled bearish reversal.
Bullish Short Put Across Multiple Expiries
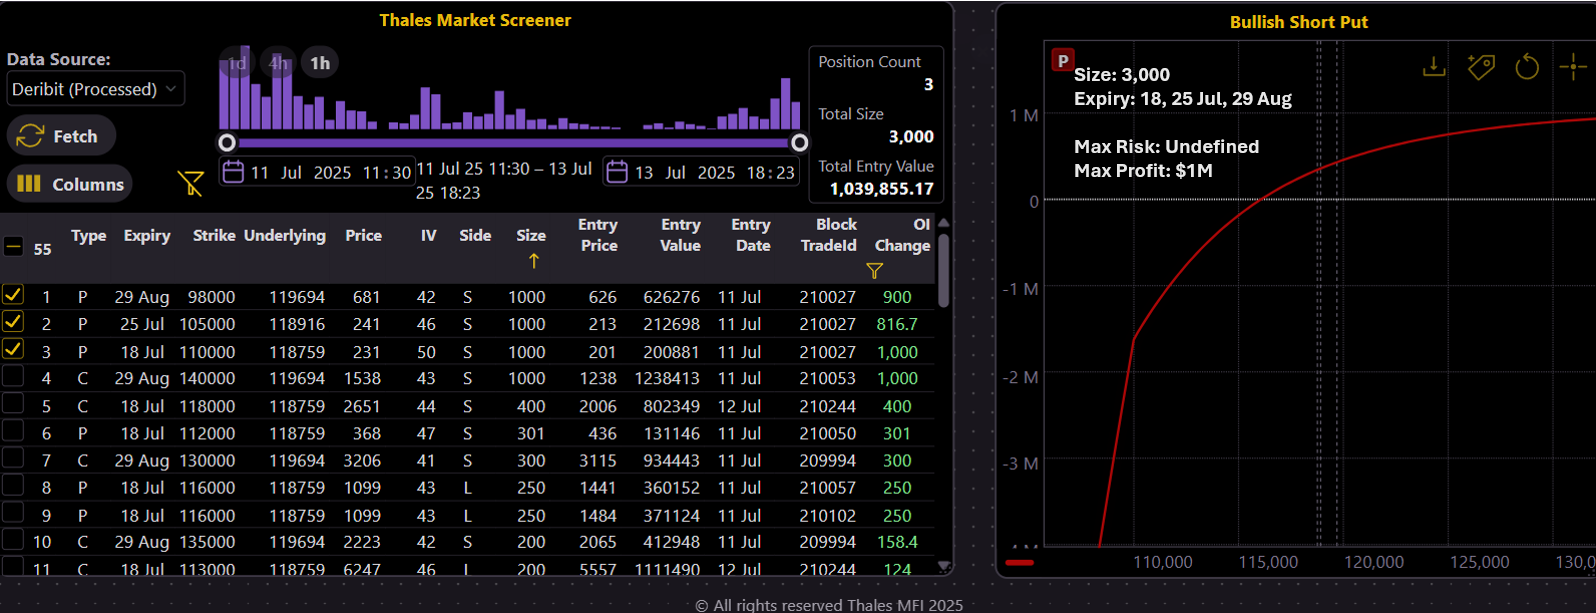
A bullish stance was observed via short put positions across three expiries—18 Jul, 25 Jul, and 29 Aug—with strikes ranging from 98k to 110k. The total size reached 3,000 contracts, targeting a max profit of $1M. However, the undefined downside risk signals confidence in sustained support above these levels.
(OSS)
Another major block trade uncovered in the Market Screener is a bullish short put strategy totaling 3,000 contracts, deployed on 11 July. The trader sold puts with strikes of 98K, 105K, and 110K, spanning expiries of 18 July, 25 July, and 29 August. This structure indicates a firm bullish stance, expecting Bitcoin to remain above all three levels.
What makes this trade stand out is not just the size, but its asymmetric risk-reward: while the max profit is $1M, the downside is theoretically unlimited if the market collapses. The positioning suggests a high level of confidence that BTC will not revisit those strike levels anytime soon — possibly a reflection of perceived price floor and volatility compression.
118K Call Butterfly for 18 July
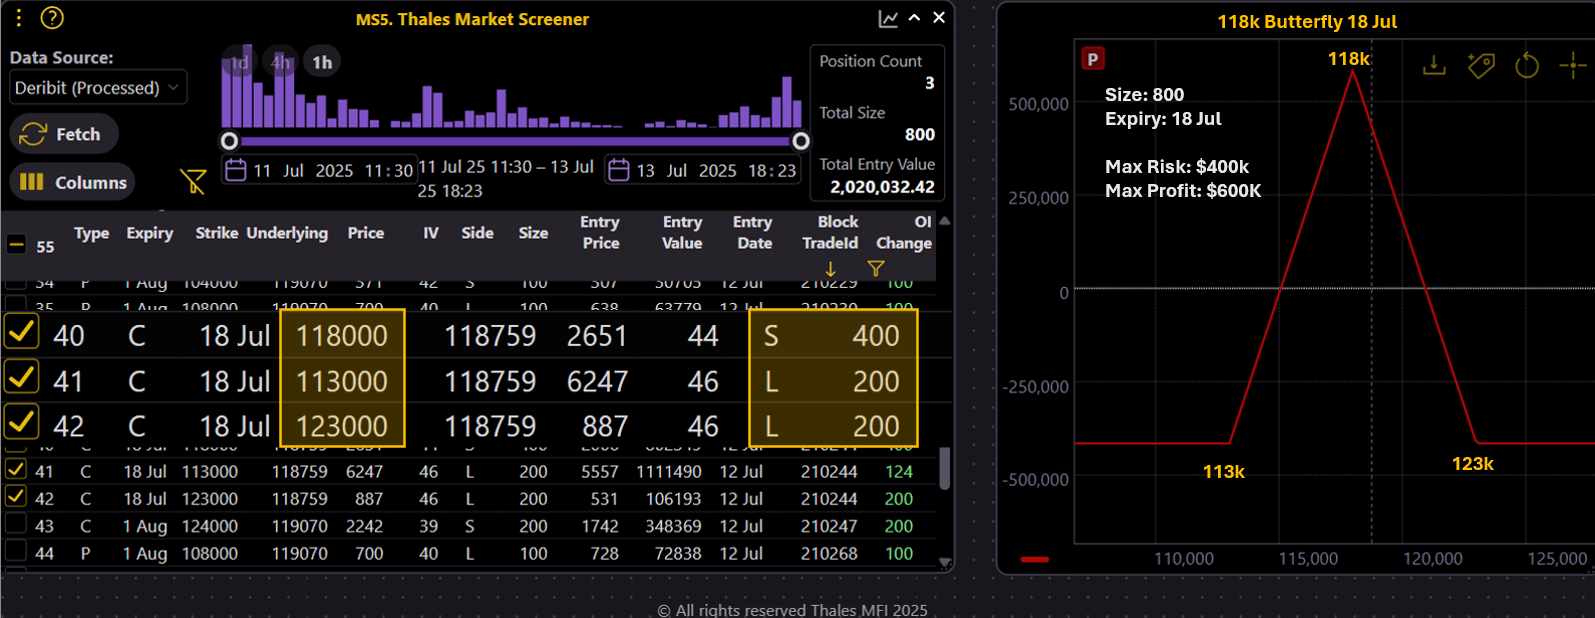
A classic short-term butterfly structure has emerged, selling 400 calls at 118k while buying 200 each at 113k and 123k. With a size of 800 contracts and expiry on 18 July, the trade risks $400k to pursue a max profit of $600k—positioning for Bitcoin to pin near 118k by expiry.
(OSS)
The third and final strategy spotted this week is a 118K call butterfly, constructed with 800 contracts for the 18 July expiry. The structure involves selling 400 calls at 118K, while buying 200 calls each at 113K and 123K. With a max risk of $400K and max profit of $600K, the risk-reward profile is relatively balanced—somewhat uncommon for butterfly trades, which usually offer higher reward multiples. The trader’s target is a pin at 118K by expiry, making this a tightly focused, range-bound position.
With this, the Outlook captures three distinct strategies with different directional convictions. One bearish, one bullish, and one neutral—such diversity in positioning reflects the very pulse of the options market. It remains to be seen which thesis proves right.
Bottom Line
Bitcoin’s surge past $118,000 has reignited directional conviction among options traders, yet volatility remains historically muted. With short-term IV fading quickly and longer-dated expiries dominated by premium selling, the market appears confident but cautious. The heatmap highlights concentration around $118K–$120K, while strategy flows reveal a mix of aggressive bullish bets, targeted neutral plays, and selective downside hedges. As we approach the 18 July expiry, the diversity of positioning — from butterflies to bold short puts — underscores a market at a pivotal point, navigating new highs with tempered expectations.
Disclaimer
The content of this blog is provided for informational and educational purposes only and does not constitute financial, investment, or trading advice. The strategies and examples discussed are intended to illustrate concepts and do not represent recommendations. Trading in derivatives, including Bitcoin options, involves substantial risk and may not be suitable for all investors. Always conduct your own research and consult with a qualified financial advisor before making any trading decisions.