Introduction
As options traders, we have often been warned about the risks of selling naked options. At the same time, we might wonder who is selling the options while everyone else is buying. The player who often comes into play here is a market maker, whose goal is not to speculate on price movements but to fill the order book, collect fees, and earn premiums. Market makers approach trading differently by actively hedging their positions against directional price movements in the underlying asset (UL). This process, often referred to as Gamma hedging, which is neither simple nor cheap.
The Delta of a position measures how much the position’s value changes for a $1 change in the UL price. In a previous blog, we explored Delta hedging in detail and identified a significant challenge: while Delta can be hedged in the spot market, it is highly dynamic, causing the position to quickly deviate from its hedged state.
This is where another Greek, Gamma, comes into play. Gamma measures the rate of change in Delta, acting as its derivative. To manage Delta more effectively over a wider range of price movements, it is essential to hedge Gamma.
In this blog, we will delve into the advanced concept of Gamma hedging. Using OSS simulations, we will analyze and calculate an exemplary portfolio’s Greeks to understand how a market maker can hedge both Gamma and Delta. This approach ensures more stability and control over their positions in volatile markets and specially as we get closer to the expiry of the options slod.
The Real-World Example: Starting with a Naked Short Call
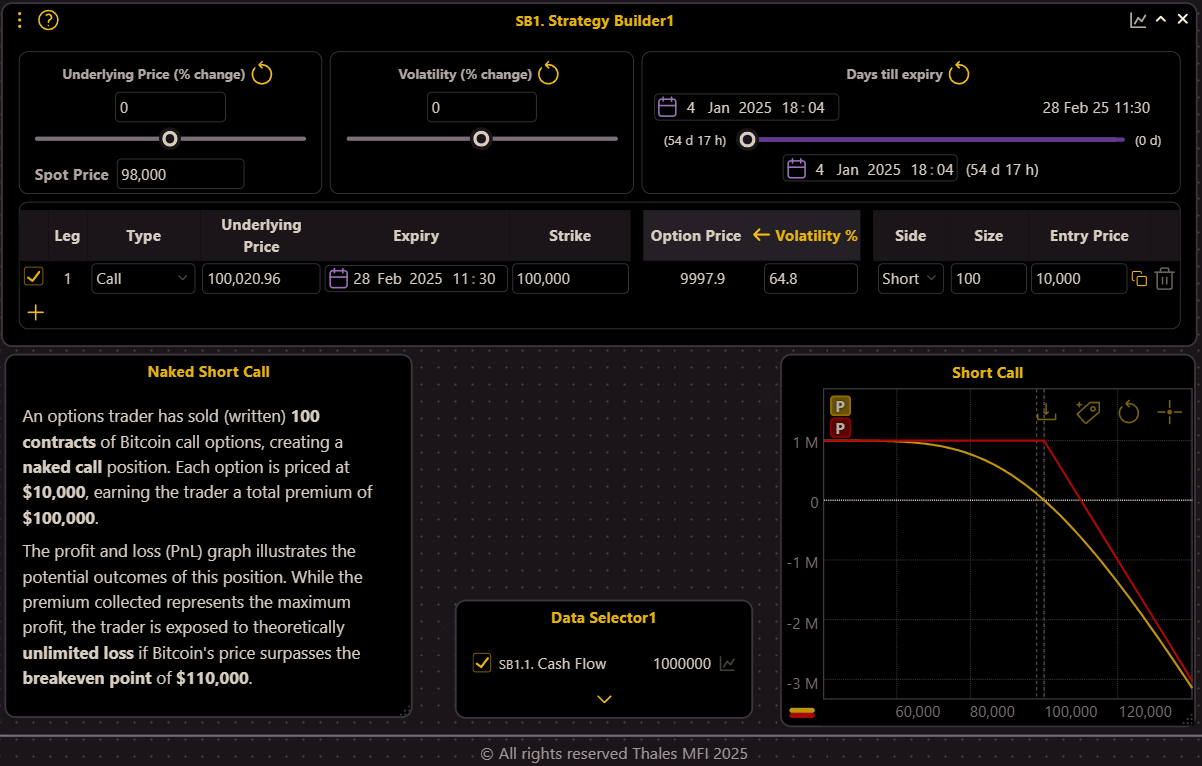
Our journey begins with a trader selling (writing) 100 contracts of Bitcoin call options with a strike price of $100,000. Priced at $10,000 per option, the trader collects a total premium of $1,000,000.
(OSS)
While this represents the maximum potential profit, the accompanying PnL graph highlights the theoretically unlimited loss should Bitcoin’s price exceed the breakeven point of $110,000. This unhedged position, referred to as a naked call, is highly risky and demands active management.
One Week to Expiry: Increased Risk Exposure
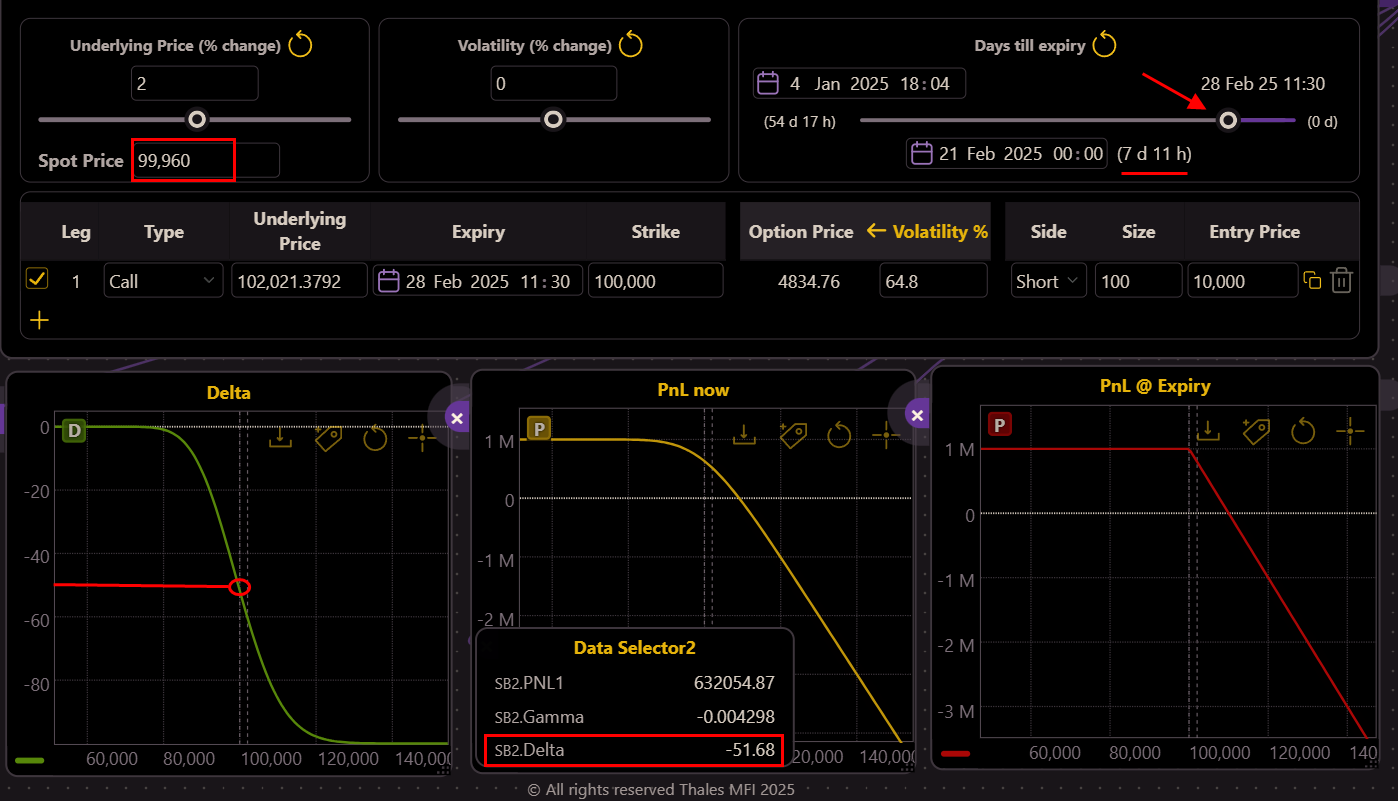
As the expiry approaches and the spot price hovers near $100,000, the trader’s position is still profitable but increasingly vulnerable.
(OSS)
The Delta, measuring the directional risk, is -51 (Left), meaning for every $1 increase in Bitcoin’s price, the position (not the single option) loses approximately $51. This steep risk exposure is evident in the PnL graph (middle), where any upward price movement (X axis) could quickly turn profits into losses (Y axis). The first step to mitigating this risk is to address the Delta.
Delta Hedging: Neutralizing Immediate Price Risk
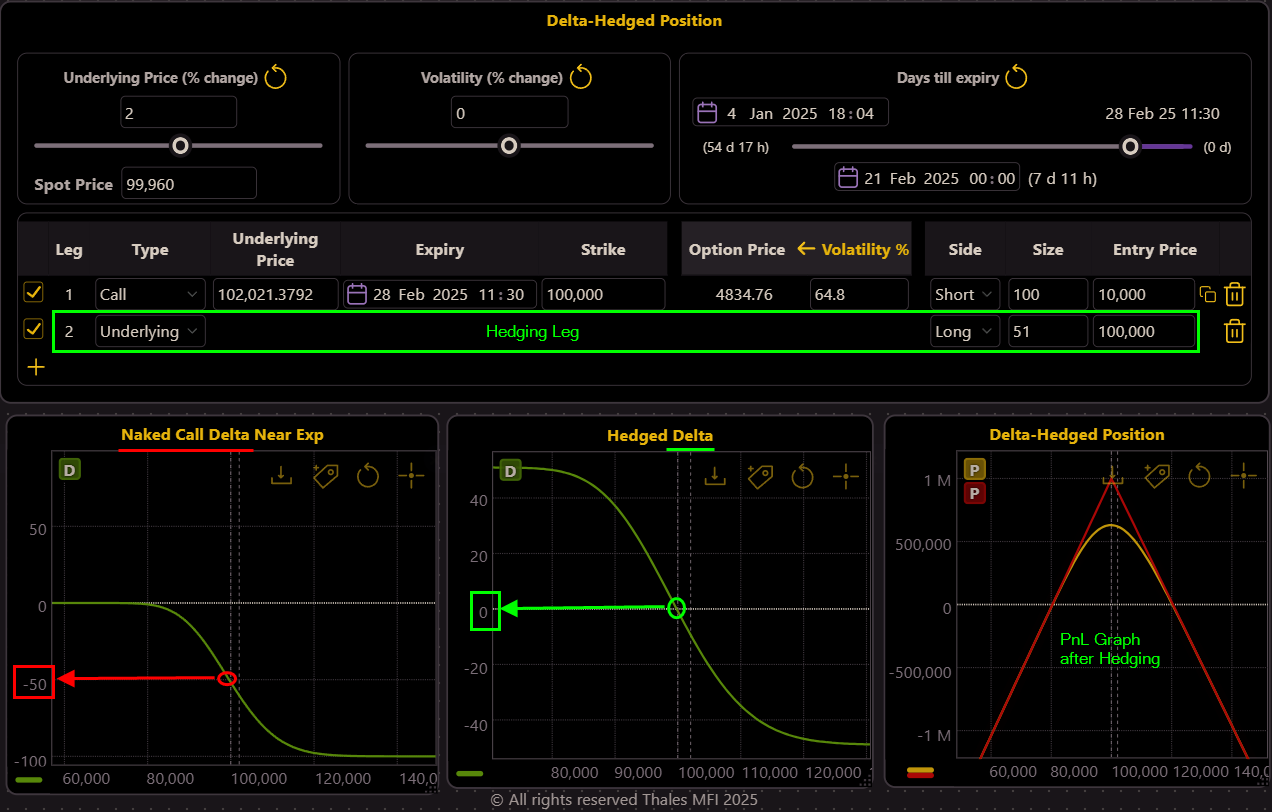
To hedge Delta, the trader takes an opposite position in the spot (or perpetual) Bitcoin market.
(OSS)
By going long 51 units of Bitcoin (see the 2nd leg in Strategy Builder), the Delta is neutralized, as reflected in the updated PnL and Delta graph. The PnL curve now shows a more symmetrical risk profile (right), and the Delta graph indicates near-zero directional exposure (middle). However, this is not the end of the story; while Delta is hedged, Gamma risk remains a challenge.
The Gamma Problem: Dynamic Risk Assessment
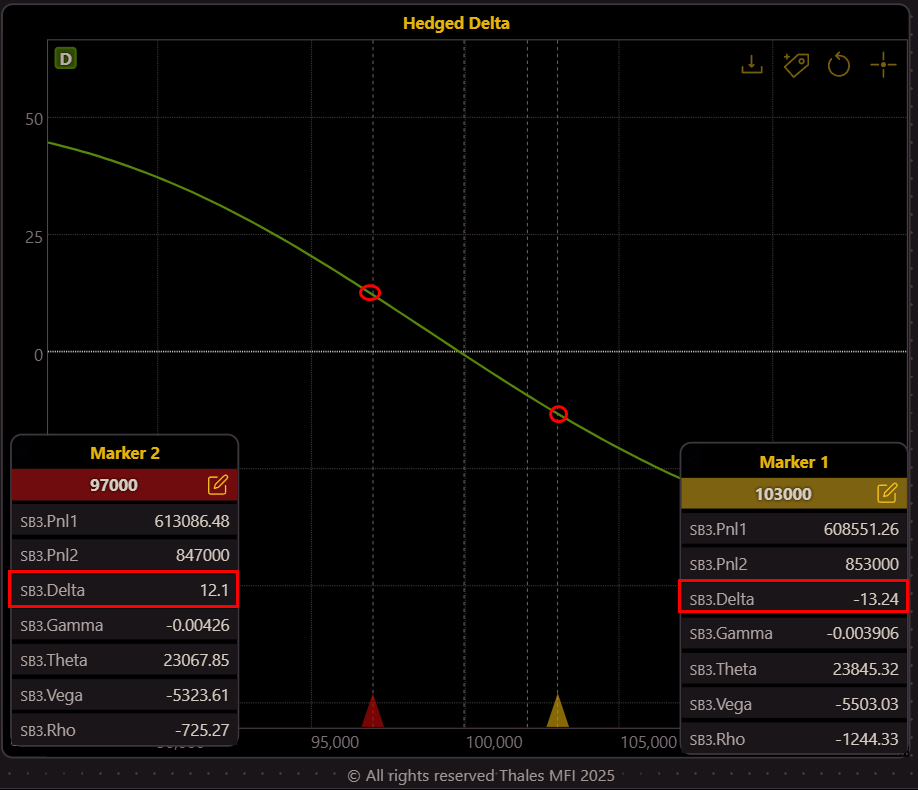
Even with Delta hedged, Gamma, which measures the rate of change of Delta, can cause the position’s Delta to shift rapidly with price fluctuations.
(OSS)
Markers on the graph reveal how a $3,000 price move in either direction pushes the Delta away from neutrality (12.1 and –13.24 at $97,000 and $103,000, respectively). This highlights the narrow effectiveness of Delta hedging alone, necessitating a strategy to hedge Gamma.
Gamma Hedging: Adding an OTM Call Option
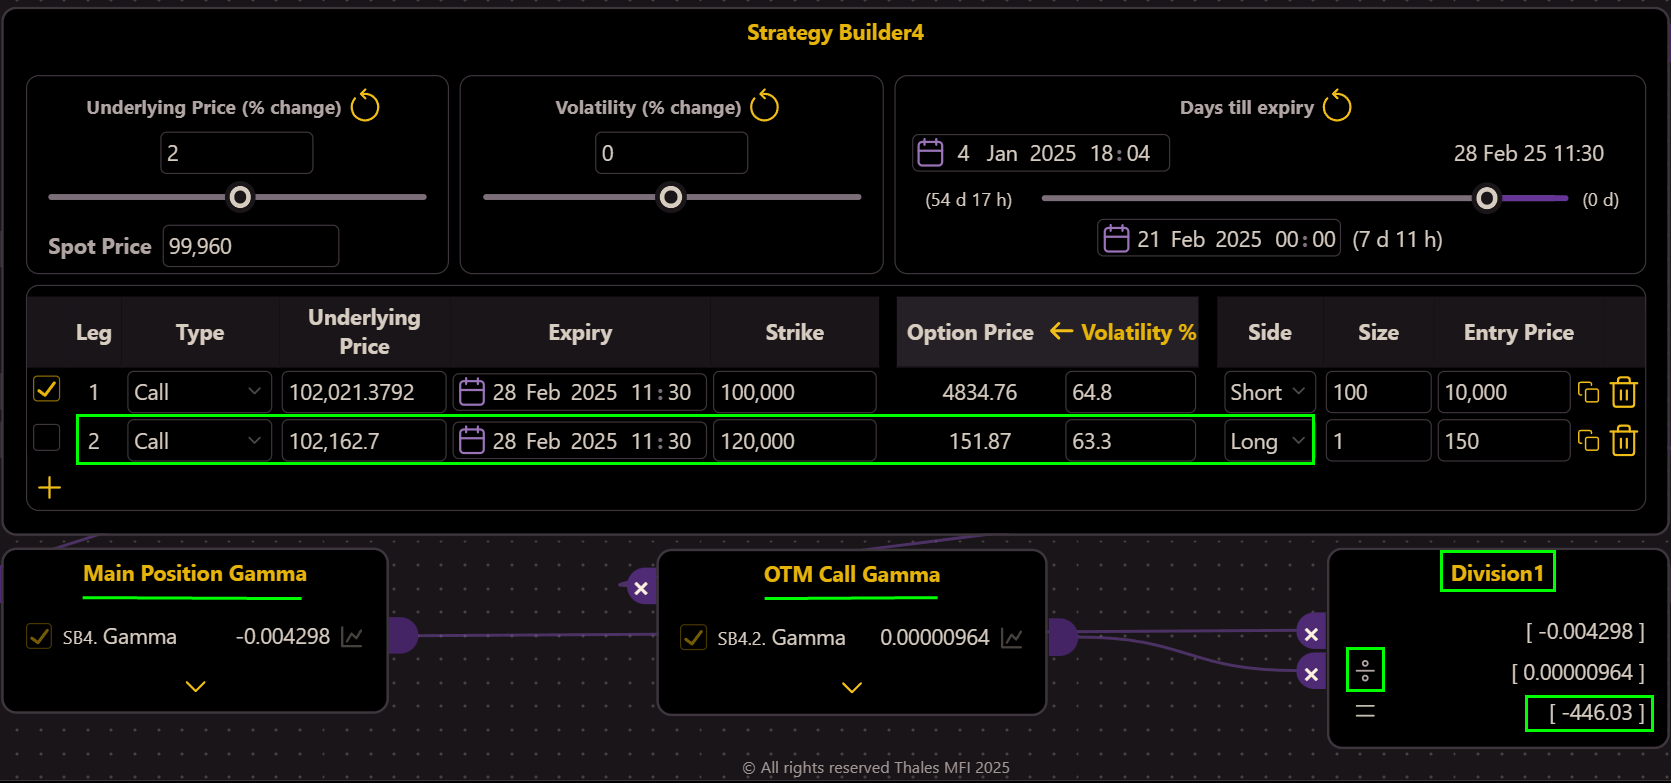
To hedge Gamma, the spot (or stock) market cannot help. Here the remedy also comes from the options market itself. The trader now decides to purchase an out-of-the-money (OTM) call option with a strike price of, say, $120,000 (see Strategy Builder below).
(OSS)
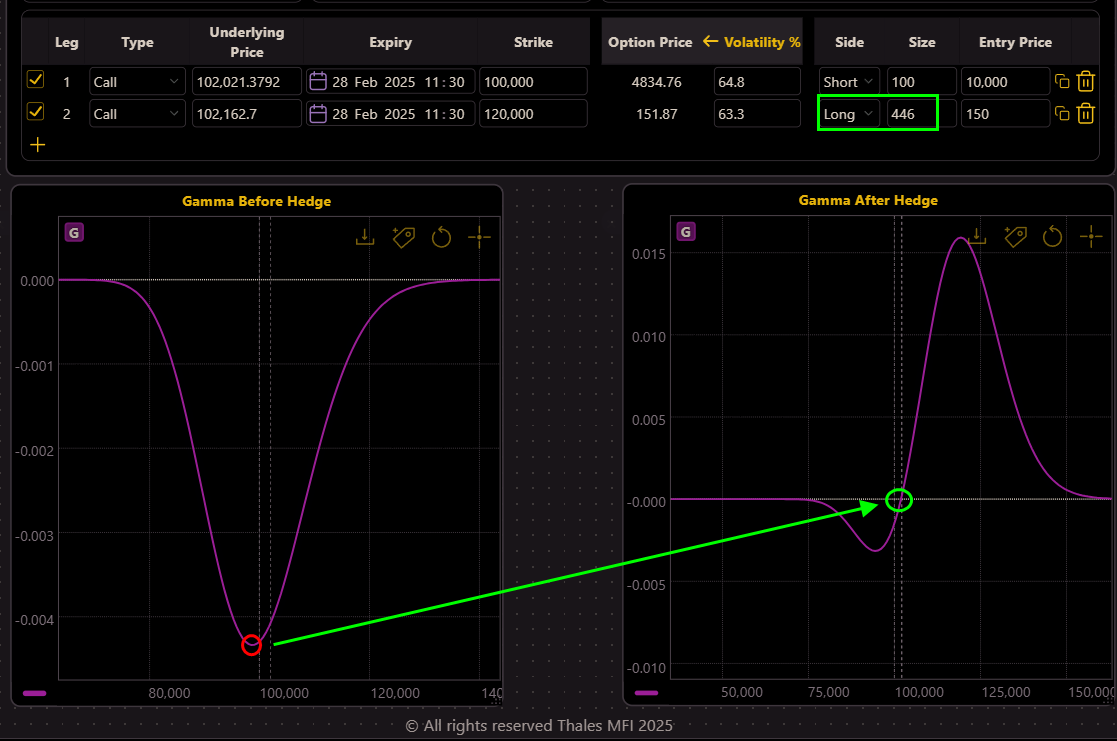
But they do not now how many contracts should they buy. Using the OSS’s Division widget, the trader calculates the required size by dividing the Gamma of the short call position by the Gamma of the OTM call (widgets below the SB). The result suggests going long 446 contracts of the call.
(OSS)
After executing this hedge, the Gamma graph (right) demonstrates near-zero, indicating that Delta changes are now more stable across a range of price movements.
The Delta Imbalance After Gamma Hedge
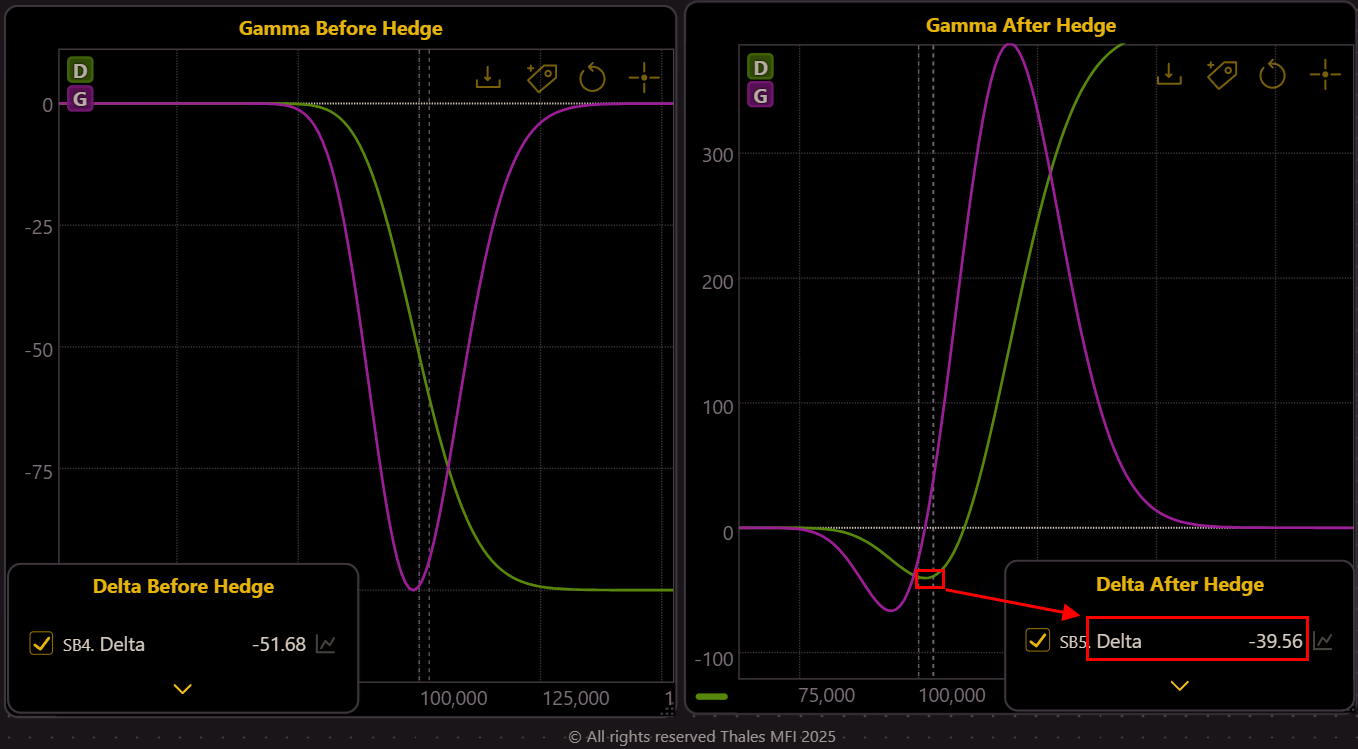
While Gamma is neutralized, the Delta of the position post-Gamma hedge remains at approximately -39.56, exposing the position to slight directional risk (see the right graph below).
(OSS)
To fully stabilize the position, the trader needs to address this Delta imbalance.
Final Step: Fully Hedging Delta and Gamma
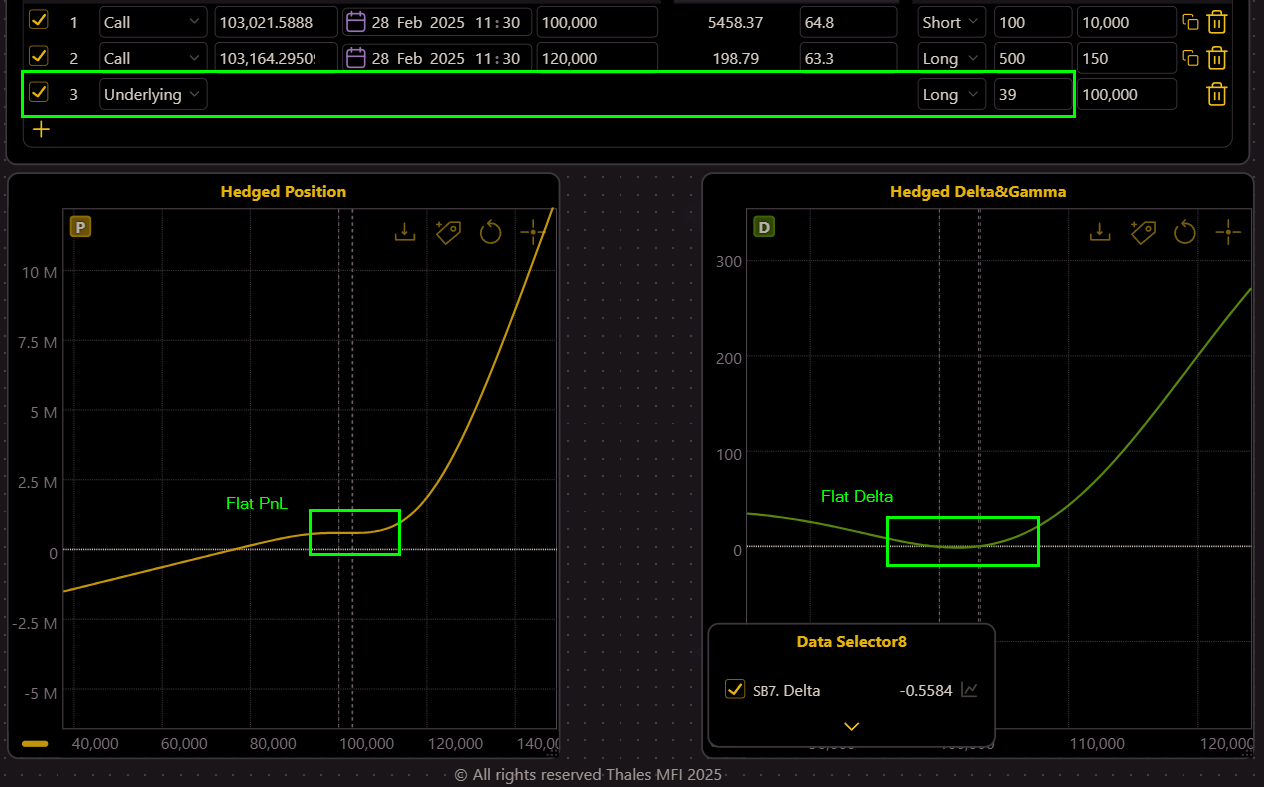
To neutralize the remaining Delta, the trader takes a long position in the underlying Bitcoin market with a size of 39 units (equal but opposite to the delta of the position).
(OSS)
This action flattens both the Delta and PnL curves, achieving a safely hedged position. The updated graphs show that Delta remains near zero across a wide price range, and the PnL curve reflects a balanced and neutralized exposure to Bitcoin’s price fluctuations.
The Bottom Line
This step-by-step guide underscores the importance of proactive risk management in options trading. By leveraging Delta and Gamma hedging techniques, traders can transform a risky naked position into a balanced, risk-neutral setup. Market makers, in particular, rely on such advanced strategies to stabilize their portfolios and maintain order book liquidity, or safely accumulating their premiums. While Delta hedging offers immediate protection against price movements, Gamma hedging ensures stability over a broader range, showcasing the value of combining these strategies.
For traders using OSS, tools like the Strategy Builder, PnL graphs, and widgets simplify complex calculations, enabling precise adjustments to trading strategies. As always, understanding the nuances of risk management is key to long-term success in options trading.
Disclaimer
The information provided in this blog is for educational and informational purposes only and should not be considered financial or investment advice. Options trading involves significant risk, and the strategies discussed may not be suitable for all investors. Past performance does not guarantee future results. Always consult with a professional financial advisor before making any investment decisions. The examples and simulations presented are illustrative and based on hypothetical scenarios, not actual market conditions.