Introduction
Bitcoin has stormed past the critical $100,000 mark, triggering excitement across the markets — yet beneath the surface, the options landscape tells a more nuanced story. In this week’s Outlook, we explore how traders positioned ahead of the 9 May expiry, why volatility remains surprisingly subdued despite the breakout, and how the current market sentiment is shaping upcoming expiries.
We’ll examine whether this rally has real momentum or if caution is quietly building for a pause or pullback. From the evolving skew between calls and puts to the calmness of the perpetuals market and options open interest, every signal points to a market walking the fine line between optimism and restraint.
Finally, we dissect recent trading activity through the Thales Heatmap and Market Screener and close with a deep dive into a notable Bull Call Ladder strategy targeting the $115K–$135K range
Explore these market dynamics firsthand with the Thales Options Strategy Simulator (OSS)
Market Snapshot
Expiry Recap – 9 May 2025
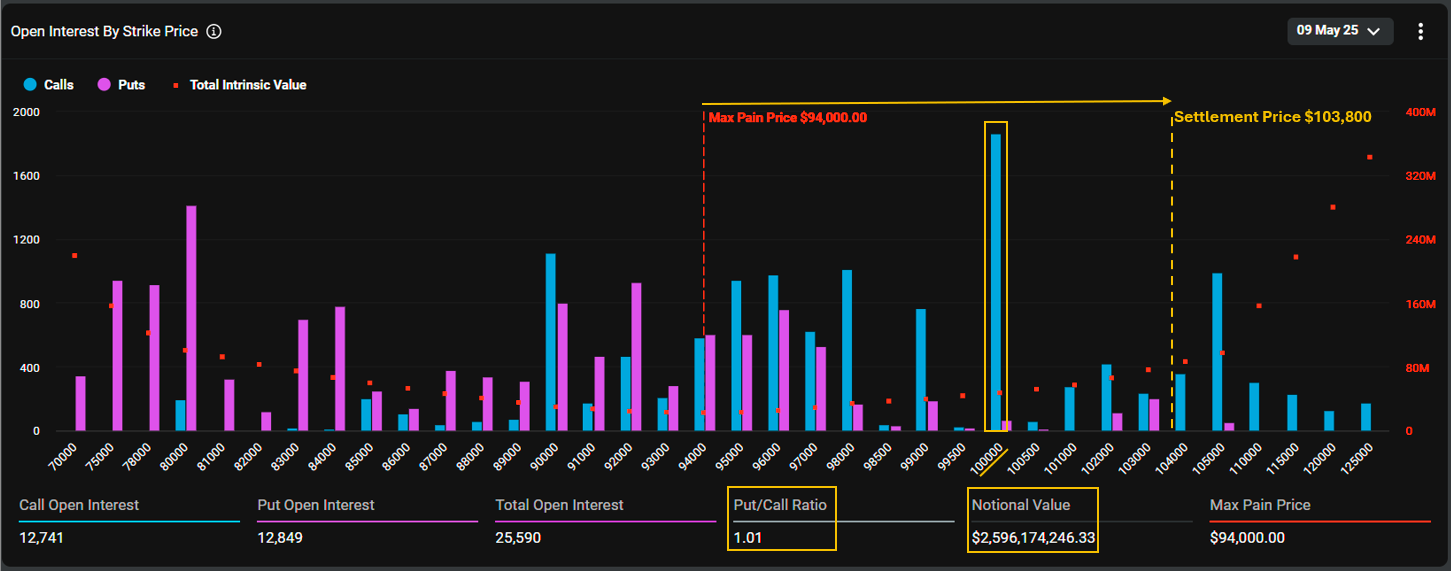
9 May expiry settled at $103.8K, with $100K strike ending deep ITM and max pain at $94K.
Bitcoin’s 9 May expiry closed decisively above the max pain level of $94,000, settling at $103,800. While this wasn’t a major monthly or quarterly expiry, it proved significant in its own right, with a total open interest of around 25,000 contracts and a substantial notional value of $2.6 billion — making it a standout weekly expiry.
What makes this expiry particularly noteworthy is that the strike with the highest open interest at $100,000 not only came into play but ended, relatively, deep in the money. This level held the largest OI across all maturities, and for those who positioned early when this strike was still out-of-the-money, the payoff was considerable.
The session also featured a Put/Call ratio above 1.0, signaling heightened uncertainty and risk appetite around key psychological price levels near $100,000. Both calls and puts were actively traded, with market participants effectively chasing volatility in a straddle-like fashion, positioning aggressively as Bitcoin hovered near its critical breakout zone. In the end, the price ran higher, and with it, those well-placed calls delivered handsomely.
Volatility Remains Calm Despite the Breakout
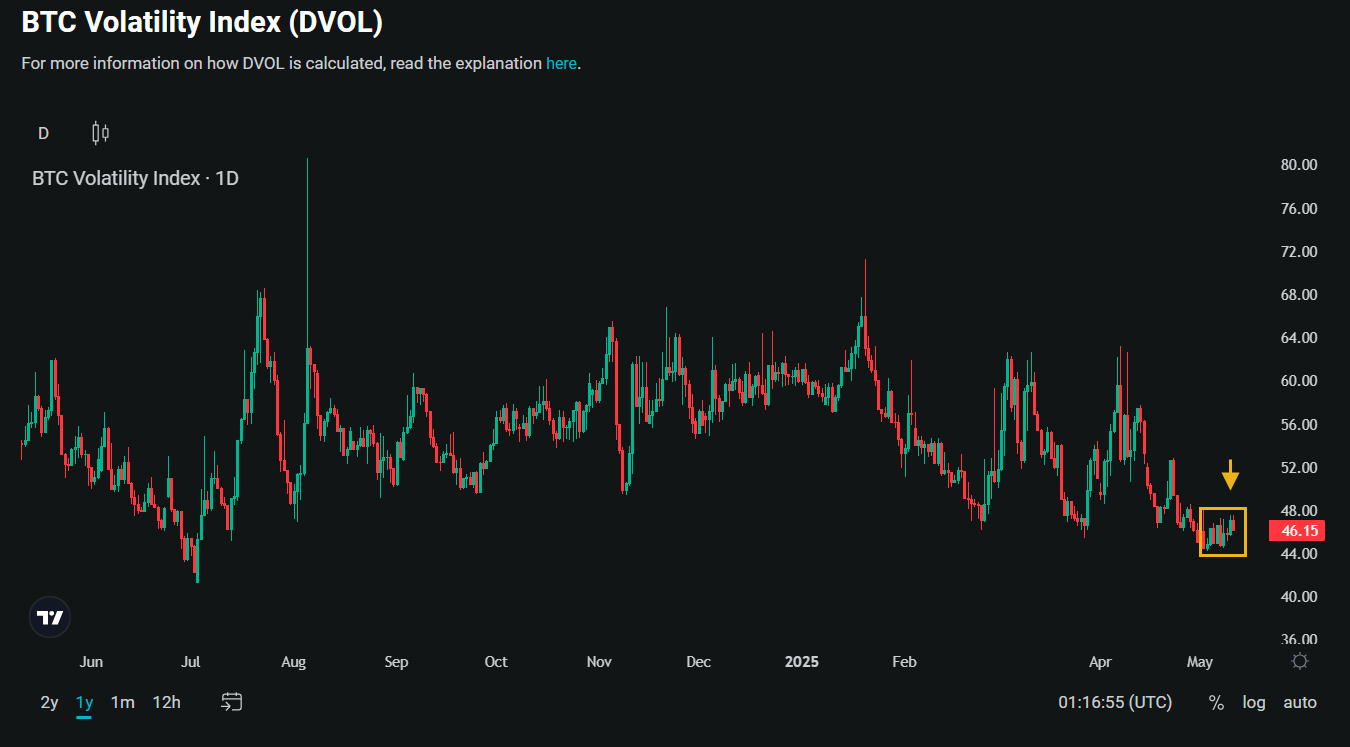
DVOL stays below 50% despite the breakout, showing the market remains cautious.
Despite Bitcoin’s recent surge past the $100,000 milestone, the options market remains interestingly composed. The Deribit Volatility Index (DVOL) continues to trade below 50%.
Open Interest Holds Steady, No Surge in Activity
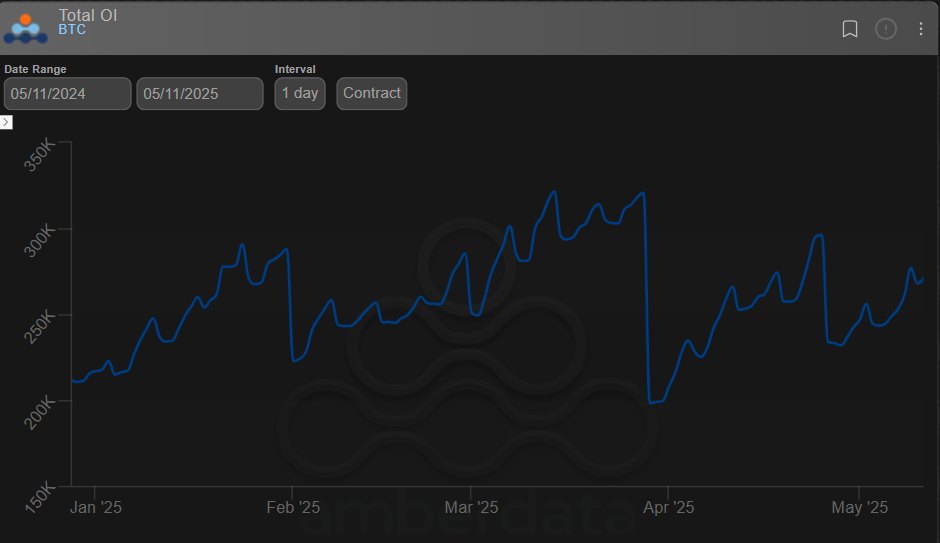
Total OI on Deribit remains flat.
The total open interest in Bitcoin options on Deribit remains stable, showing no significant build-up despite the price rally. As illustrated in the chart above, OI continues to hover below the highs seen in late March, reflecting a market that is participating — but not aggressively re-leveraging.
Perpetuals Market: Sentiment Builds, But No Overheating Yet

Funding rates show a moderate uptick, but no signs of excessive bullish leverage yet.
When sentiment truly grips the market, it often manifests first in the perpetual futures market, where retail traders rush in with leverage, and larger players adjust hedges accordingly.
The chart above shows the OI-weighted funding rate for Bitcoin perpetuals, and while we’ve seen a moderate uptick, it’s far from the kind of aggressive spike typically associated with euphoric buying.
Skew Confirms Bullish Sentiment Persists
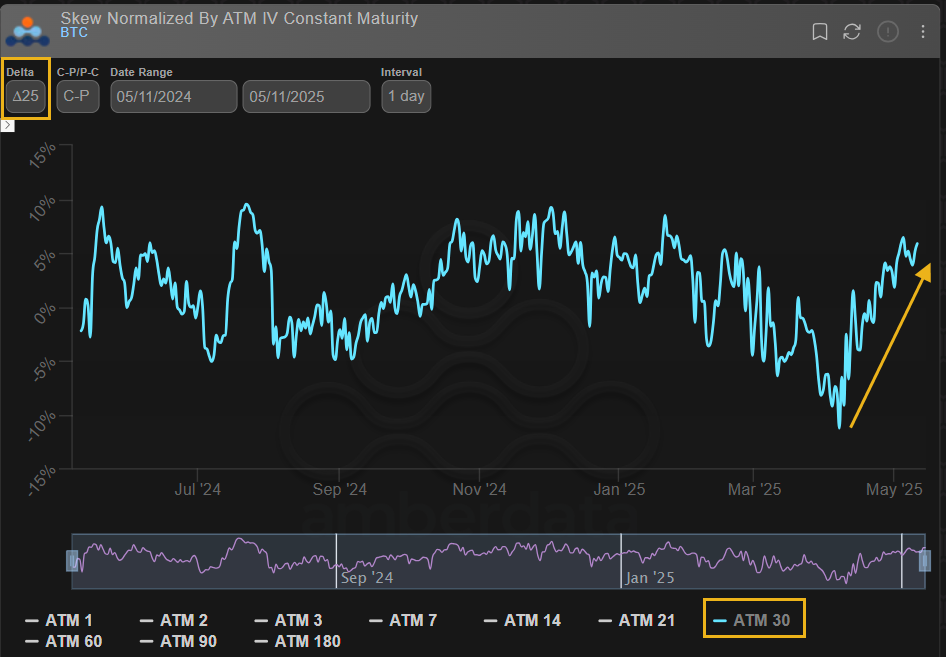
Skew continues to favor calls, confirming persistent bullish sentiment.
Regardless of where volatility stands, it’s critical to assess how it’s distributed between similar calls and puts. The chart above tracks the 25-delta call-put skew normalized by ATM IV, providing a clear view of market bias.
As highlighted in last week’s Outlook, this skew had already begun shifting significantly in favor of call options, indicating growing bullish sentiment. That expectation has since played out in price action, and notably, the skew remains firmly tilted toward calls. Traders continue to show preference for upside exposure, reinforcing the view that the market sees further room for Bitcoin to climb in the near term.
Next Expiries
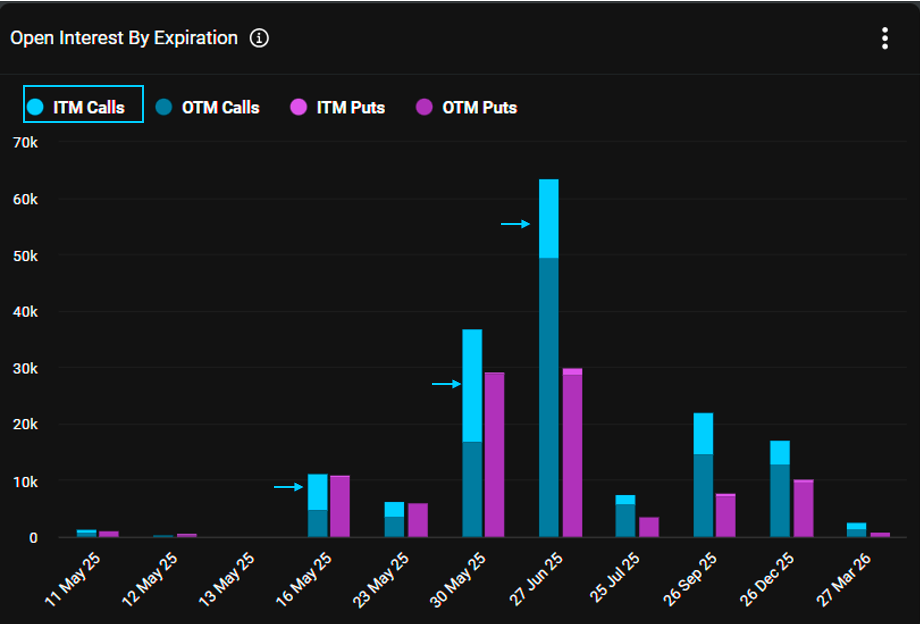
Most calls for 30 May expiry are ITM, while 16 May shows balanced positioning.
The call-put skew discussed earlier is already leaving its mark on the positioning across upcoming maturities. As shown in the chart above, a significant portion of call options are now in-the-money, particularly for the 30 May expiry — highlighted by the light blue bars. In contrast, almost no put positions are ITM for that same maturity, underlining the recent strength of the bullish move.
Interestingly, for the 16 May expiry, we observe a more balanced distribution between calls and puts, suggesting the market is hedging both ways. Could this reflect growing caution and a potential expectation of a short-term correction or consolidation before the rally resumes?
Recent Activities
Thales Heatmap
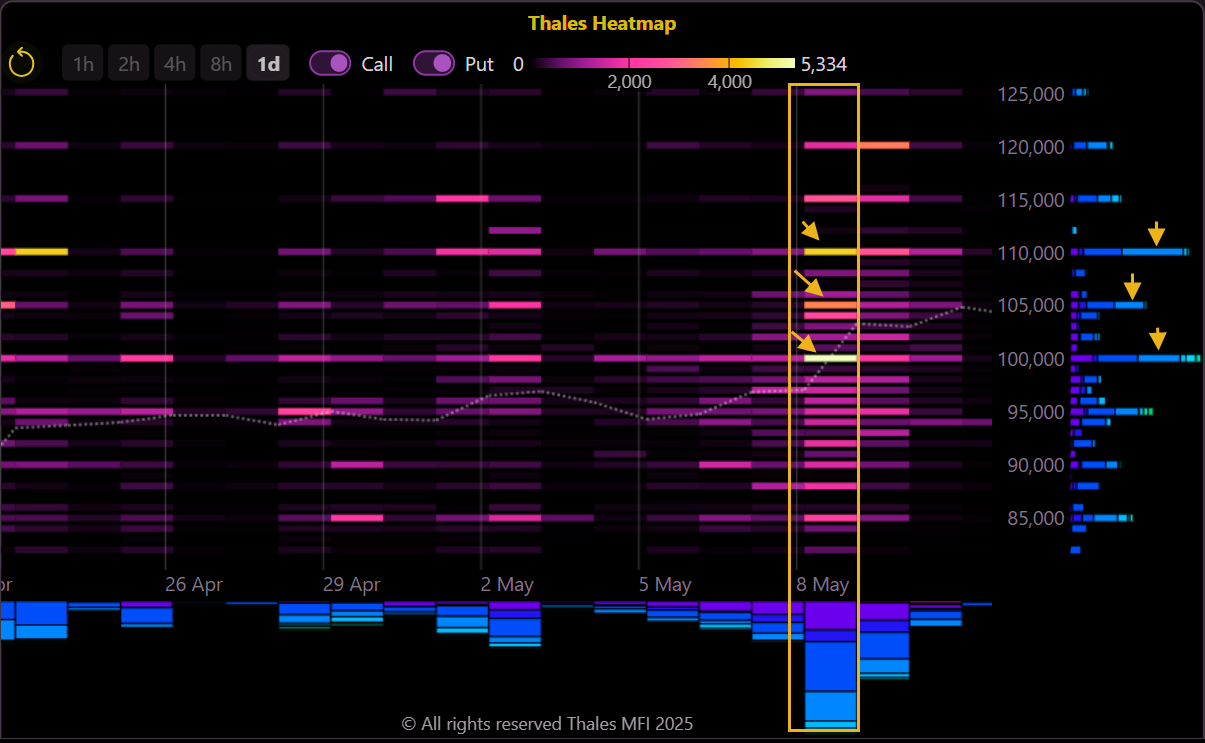
Breakout above $100K on 8 May triggered strong call activity at 100K, 105K, and 110K strikes.
(OSS)
To gauge where Bitcoin options traders have been most active, the Thales Heatmap offers a clear visual snapshot. On 8 May, as Bitcoin decisively broke through the critical $100,000 resistance level, the Heatmap lit up with a surge in trading activity.
The most heavily traded strikes during this session were $100K, $105K, and $110K, pointing to a strong bullish sentiment in the immediate term. This flurry of call activity suggests traders were quick to position for potential further upside following the breakout.
16 & 30 May Expiries
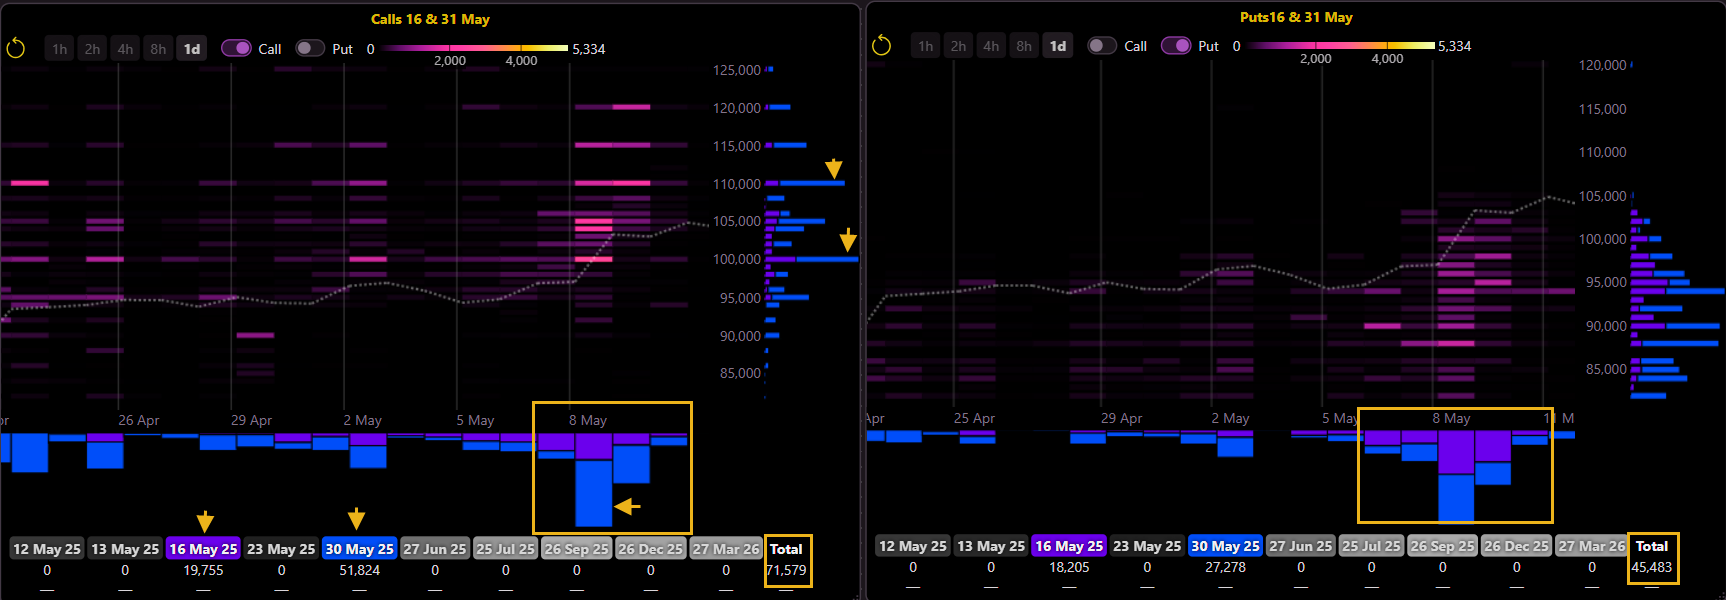
Calls dominate 30 May expiry while puts lead 16 May, suggesting short-term caution.
(OSS)
To better assess recent flows, we filtered trades from early May, focusing on the 16 May and 30 May expiries. The data shows a short-term defensive stance with puts dominating for 16 May, while calls lead for 30 May, pointing to bullish expectations beyond next week.
Calls centered around $100K to $120K, while puts focused on $88K to $98K. Overall, call volumes were 1.5 times higher than puts, confirming a bullish tilt despite near-term caution.
Thales Market Screener
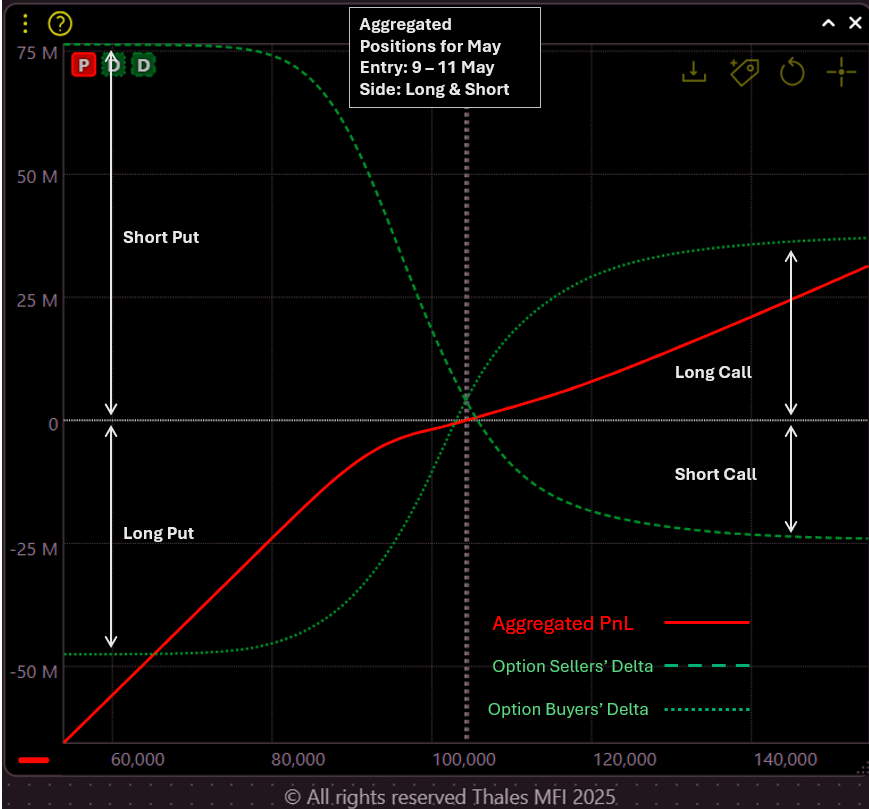
Overall PnL curve reflects a long risk reversal; puts outpace calls on both sides.
(OSS)
To dive deeper into recent trading flows, we turn to the Thales Market Screener, filtered for entries between 9–11 May. The chart above displays the aggregated PnL profile (red curve) from all relevant trades — combining long and short positions across both calls and puts. While the line represents the net effect of positioning (i.e., longs minus shorts), we’ve also overlaid the delta curves of buyers (dotted green) and sellers (dashed green) to reveal the internal structure of each side.
The overall shape of the PnL curve resembles a Long Risk Reversal, suggesting traders have predominantly sold puts to finance long calls — a bullish strategy.
Looking at Delta curves separately, both sides show heavier put activity compared to calls: buyers leaned more on long puts, while sellers were more active in short puts. Strikes are mostly clustered around $100K, reflecting a focus on near-the-money exposure consistent with recent spot levels. Altogether, the data reflects a cautiously bullish stance into May, with positioning concentrated and strategic.
Strategy Spotlight – Bull Call Ladder Targeting $115K–$135K
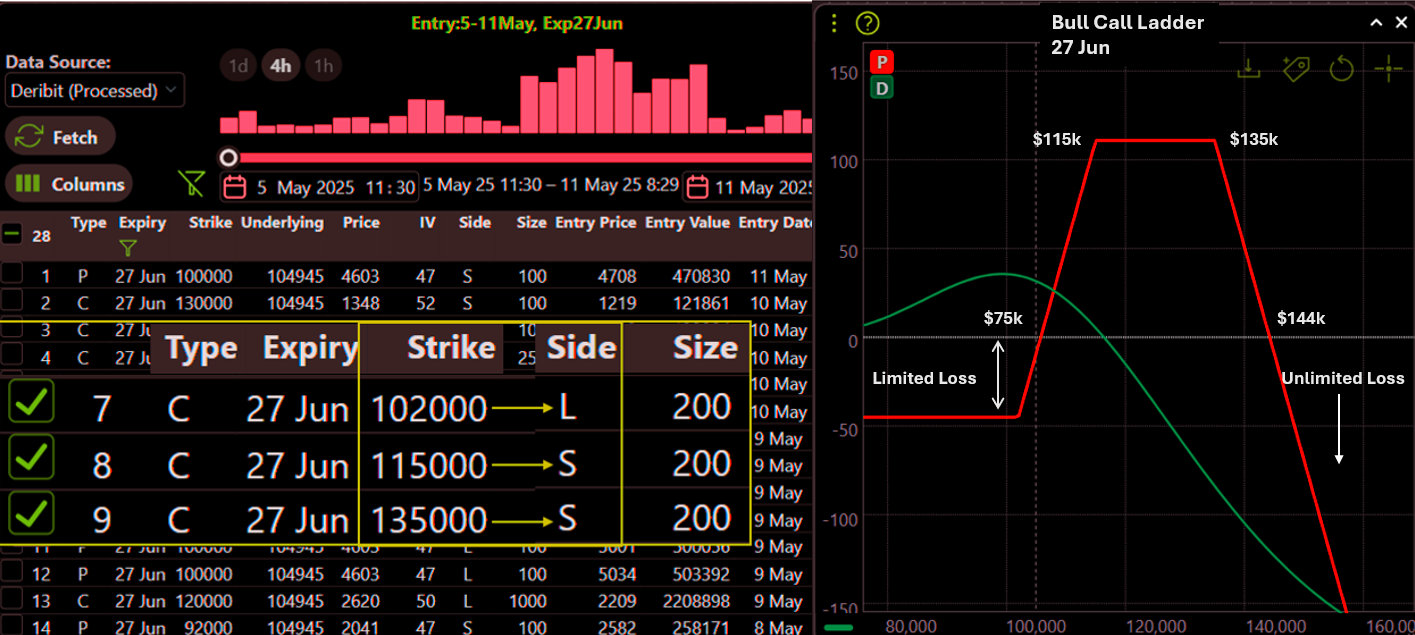
Bull Call Ladder for 27 Jun targets $115K–$135K with limited downside and capped upside.
(OSS)
In this week’s Strategy Spotlight, we highlight a notable Bull Call Ladder identified using the Thales Market Screener, set for the 27 June expiry. Applying filters for trades entered between 5–11 May, we uncovered a significant position totaling 600 contracts (600 Bitcoin).
The structure of the strategy is as follows:
- Long 200 Calls at $102,000
- Short 200 Calls at $115,000
- Short 200 Calls at $135,000
This setup combines a classic Bull Call Spread with an additional short call further out-of-the-money, forming a Bull Call Ladder. The PnL profile peaks if Bitcoin settles between $115,000 and $135,000 on June 27. The break-even points are at $75,000 and $144,000, making the strategy profitable within this range.
Risk-wise, losses are limited if Bitcoin falls below $75,000, but the strategy faces unlimited losses if the price rises above $144,000. This suggests the trader expects Bitcoin to rise moderately but avoids any extreme breakout above $144,000.
In summary, this is a moderately bullish strategy, betting on a controlled price rise while actively avoiding a sharp rally beyond $144,000. As always, such positions can be adjusted before expiry based on market dynamics, and this spotlight serves to provide insight rather than specific recommendations
Bottom Line
Despite Bitcoin’s decisive breakout above the $100,000 mark, the options market remains composed, with no signs of excessive leverage or volatility panic. Positioning suggests a cautious but clear bullish bias, particularly for the end of May and beyond. While short-term hedging is evident for the coming week, traders remain optimistic about higher price levels into late May and June. With call skews elevated, perpetual funding rates stable, and strategic positioning favoring upside — the market seems comfortable riding this rally, as long as it remains within controlled bounds.
Disclaimer
This report is for informational purposes only and does not constitute financial advice or investment recommendations. All trading involves risk, and past performance is not indicative of future results. Readers should conduct their own research or consult with a qualified financial advisor before making any trading decisions.